/* GDCHART 0.11.1b 3D Bar sample 17 June 2001 */
#include <stdio.h>
#include "gdc.h"
#include "gdchart.h"
main()
{
int num_points = 4,
num_sets = 1;
float data [ num_sets ][ num_points ];
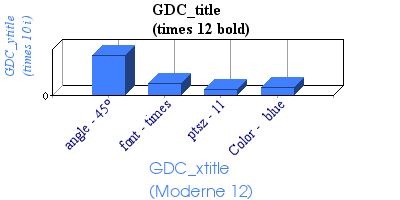
char *lbls[] = { "angle - 45°", "font - times", "ptsz - 11", "Color - blue", "" };
get_data( num_sets, num_points, data, 0, 500 );
GDC_BGColor = 0xFFFFFF;
GDC_PlotColor = 0x4080FF;
GDC_title = "GDC_title\r\n(times 12 bold)";
GDC_title_font = "timesbd.ttf";
GDC_title_ptsize = 12;
GDC_xtitle = "GDC_xtitle\r\n(Moderne 12)";
GDC_xtitle_font = "Moderne.ttf";
GDC_xtitle_ptsize = 12;
GDC_ytitle = "GDC_ytitle\r\n(times 10 i)";
GDC_ytitle_font = "timesi.ttf";
GDC_ytitle_ptsize = 10;
GDC_xaxis_angle = 45.0;
GDC_xaxis_font = "times.ttf";
GDC_xaxis_ptsize = 11.0;
GDC_XLabelColor = 0x000080;
GDC_bar_width = 60; /* (%) */
GDC_image_type = GDC_PNG;
/* ---- call the lib V0.11.1 ----- */
GDC_out_graph( 400, 200, /* width, height */
stdout, /* open FILE pointer */
GDC_3DBAR, /* chart type */
num_points, /* num points per data set */
lbls, /* X labels array of char* */
1, /* number of data sets */
(float*)data; /* data */
(float*)NULL ); /* no right-hand-axis data */
exit(0);
}
/* --------------------------------------------------------- */
/* sample data gathering routine */
/* data can come from anywhere, generally a DB or data file */
/* here it's randomly generated */
/* --------------------------------------------------------- */
#include <stdlib.h> /* for rand() */
#include <time.h> /* for seed */
get_data( int num_sets,
int num_points,
float data[num_sets][num_points],
int low,
int high )
{
int i, j;
srand( (unsigned int)time((time_t)NULL) );
for( i=0; i<num_sets; ++i )
for( j=0; j<num_points; ++j )
/* random number between low & high */
data[i][j] = 1.0+low+(high * rand()/(RAND_MAX+1.0));
}