|
The discovery of base flipping
to initiate DNA replication and RNA transcription would not have occurred using frequency logos. |
 Under most circumstances
one should not
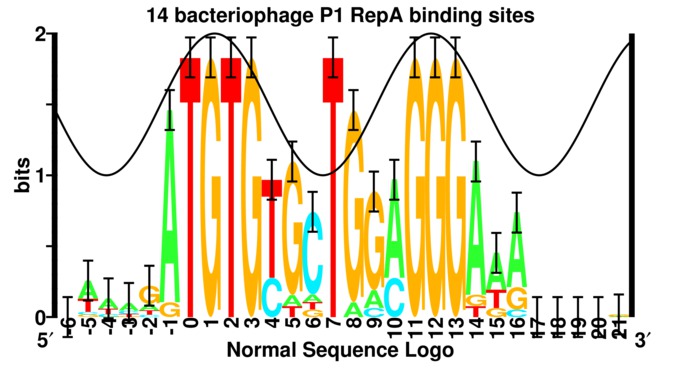
use "flat" frequency logos
(left figure)
because important biological information is lost.
A 'frequency logo' or 'equallogo' is like a regular sequence logo but all stacks
have the same height so that each letter height
is proportional to the frequency of the corresponding
nucleotide or amino acid.
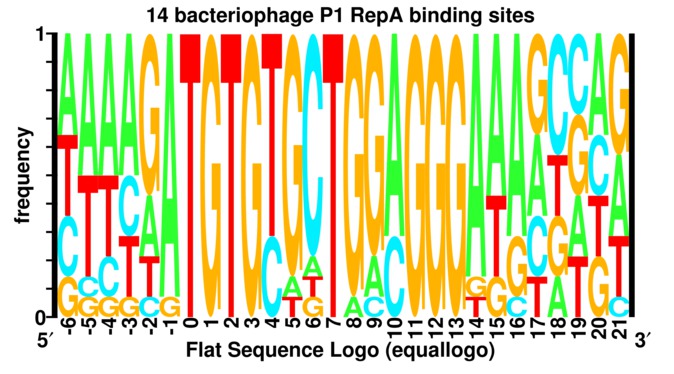
In contrast,
the height of each stack of the standard sequence logo
(right figure)
represents the sequence conservation of the sequences
measured in bits, a precise and unique unit that
is related (but not proportional) to the binding energy
(see the papers
edmm
and
emmgeo
for more on this important relationship).
This is a biologically important summary and if it is not given
then a person cannot easily tell what parts are more important
that other parts.
Furthermore, the user will miss the beautiful sine wave on many
conventional DNA sequence logos
(See the
Under most circumstances
one should not
use "flat" frequency logos
(left figure)
because important biological information is lost.
A 'frequency logo' or 'equallogo' is like a regular sequence logo but all stacks
have the same height so that each letter height
is proportional to the frequency of the corresponding
nucleotide or amino acid.
In contrast,
the height of each stack of the standard sequence logo
(right figure)
represents the sequence conservation of the sequences
measured in bits, a precise and unique unit that
is related (but not proportional) to the binding energy
(see the papers
edmm
and
emmgeo
for more on this important relationship).
This is a biologically important summary and if it is not given
then a person cannot easily tell what parts are more important
that other parts.
Furthermore, the user will miss the beautiful sine wave on many
conventional DNA sequence logos
(See the ![]() gallery
which was pubished in
figure 6 of the paper
Information Analysis of Sequences that Bind
the Replication Initiator RepA
Papp, P. P., D. K. Chattoraj, and T. D. Schneider. 1993.
J. Mol. Biol. 233: 219-230.).
gallery
which was pubished in
figure 6 of the paper
Information Analysis of Sequences that Bind
the Replication Initiator RepA
Papp, P. P., D. K. Chattoraj, and T. D. Schneider. 1993.
J. Mol. Biol. 233: 219-230.).
For example, the figure of a `flat' logo for the RepA DNA binding protein from bacteriophage P1 (helixrepa) does not give much indication of anything special. However, the corresponding sequence logo shows two major clusters of sequence conservation in positions -1 to +3 and +11 to +13 with an additional strong conservation at +7 and +8. By placing a sine wave over the logo that has a wave length 10.6 bases long, it becomes clear that the two big patches of sequence conservation are one turn of double stranded DNA apart. That RepA protein binds to the face of the DNA with the two strong conservation patches was subsequently confirmed experimentally (Papp et al 1993, Papp and Chattoraj 1994), as indicated by the solid (instead of dashed) sine wave. A protein binding to DNA through the major groove can distinguish up to 2 bits of information and this is consistent with the two large conservation patches. A protein binding to DNA through the minor groove DNA cannot specify more than 1 bit (baseflip) so the T at postion +7 violates B-form DNA. We proposed that RepA flips a base out of the DNA to initiate DNA replication and partially confirmed this experimentally (repan3).
When a crystal structure of RNA polymerase in the initiation compex was obtained, it showed base flipping as predicted from the information type sequence logo:
'Base-specific interactions occur primarily with A(-11) and T(-7), which are flipped out of the single-stranded DNA base stack and buried deep in protein pockets.'and
'the entire T-7 nucleotide is flipped out of the base stack (as predicted by Schneider, 2001)'(A. Feklistov and S. A. Darst, Structural basis for promoter -10 element recognition by the bacterial RNA polymerase sigma subunit, Cell 147: 1257-1269, pmid 22136875, 2011)
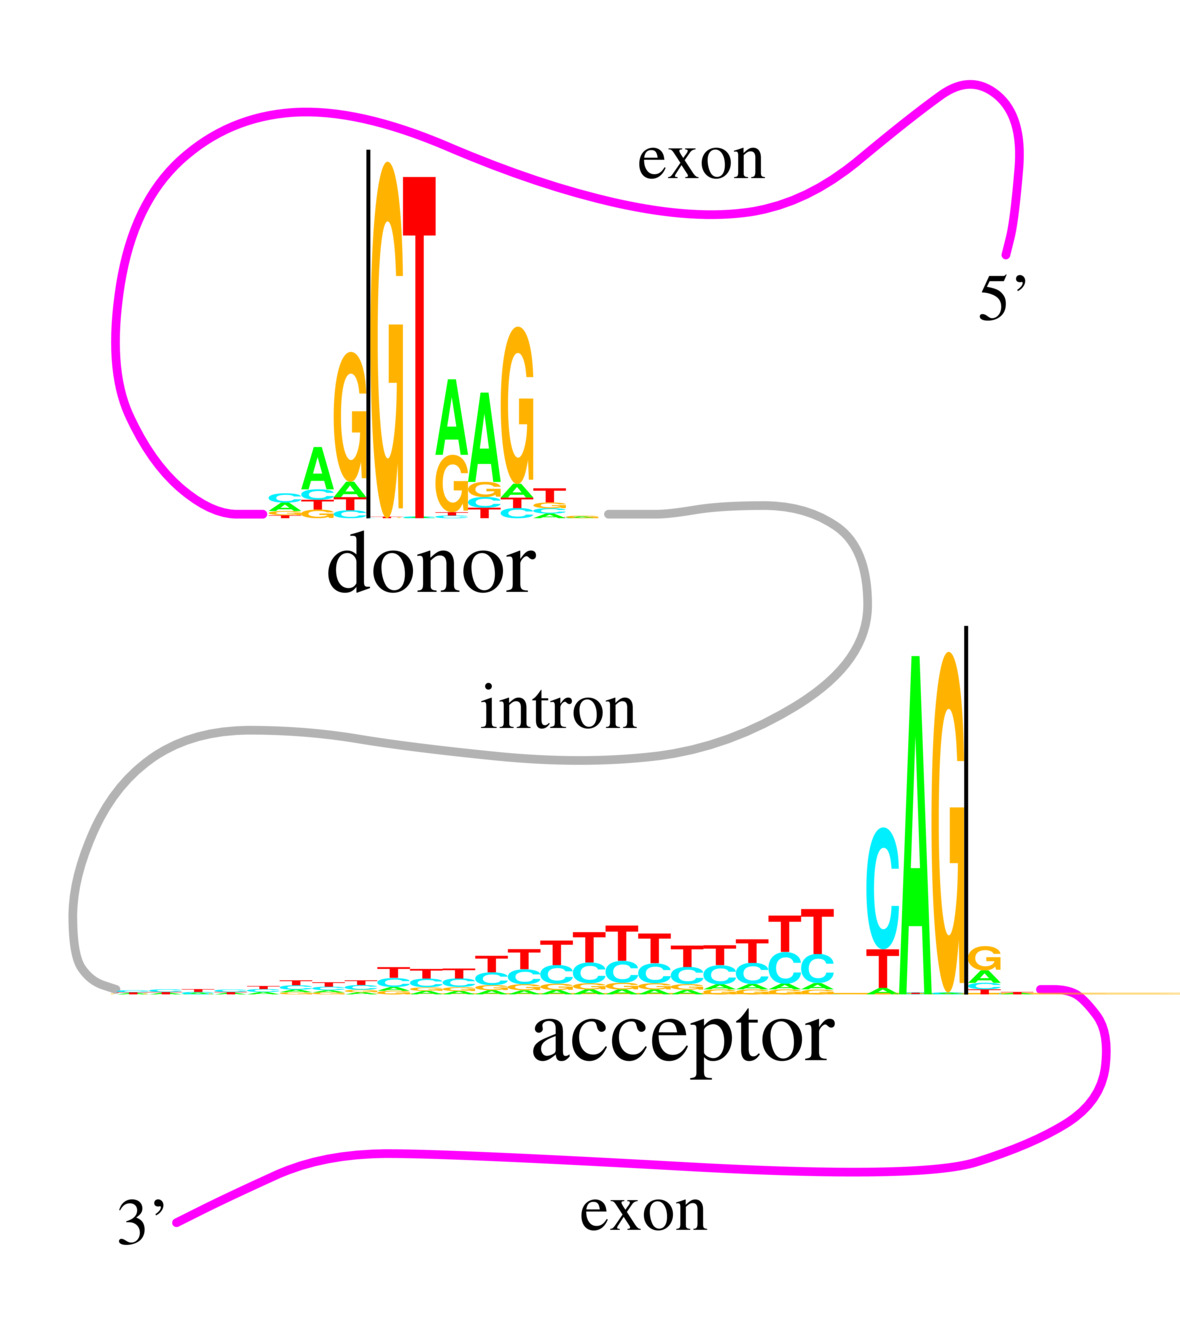 Indeed, using a frequency logo means that one will miss
the original reason we invented sequence logos.
We observed that
human donor and acceptor splice sites have the same consensus
sequence: CAG|GT (see figure to the right).
Yet the information conservation across the binding sites
is not the same at each position.
How could two RNA binding sites have the same consensus
but be different?
We invented sequence logos to visualize and resolve this paradox
(Stephens.Schneider-splice1992).
Indeed, using a frequency logo means that one will miss
the original reason we invented sequence logos.
We observed that
human donor and acceptor splice sites have the same consensus
sequence: CAG|GT (see figure to the right).
Yet the information conservation across the binding sites
is not the same at each position.
How could two RNA binding sites have the same consensus
but be different?
We invented sequence logos to visualize and resolve this paradox
(Stephens.Schneider-splice1992).
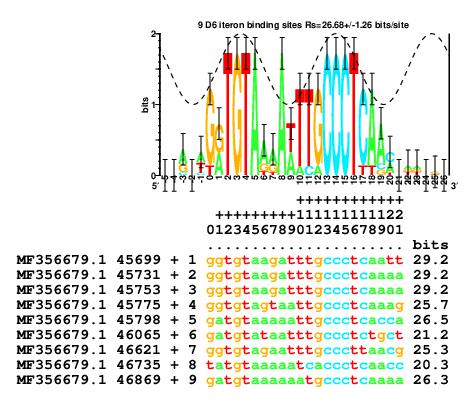 As a final example that comes full circle to the original
observation of base flipping in RepA iterons,
in 2018
the bacteriophage D6 iterons were reported as a
consensus, and so the flipping base, which is
easily identified in a sequence logo was missed
(pubmed 29304472).
The sequence logo shows that
bases +2, +3 and +4 are fully conserved as TGT, as in the RepA site.
Bases +13, +14 and +15 are fully conserved as CCC,
the complement of the RepA GGG.
This is consistent with proposed 180 degree rotations of the GGG
binding subunit during evolution which is observed in
the F and pCU1 plasmids
(Chattoraj.Schneider1997.
The block of conservation around the CCC,
3 bases on the 5' side and 3 bases on teh 3' side,
suggests assignment
of the middle C at +14 to be the center of the major groove,
represented as the peak of a sine wave with wavelength 10.6
bases. With that assignment, the TGT is exactly in the major
groove, just as in RepA.
This places an A at position +8 exactly into the center
of the minor groove.
As a final example that comes full circle to the original
observation of base flipping in RepA iterons,
in 2018
the bacteriophage D6 iterons were reported as a
consensus, and so the flipping base, which is
easily identified in a sequence logo was missed
(pubmed 29304472).
The sequence logo shows that
bases +2, +3 and +4 are fully conserved as TGT, as in the RepA site.
Bases +13, +14 and +15 are fully conserved as CCC,
the complement of the RepA GGG.
This is consistent with proposed 180 degree rotations of the GGG
binding subunit during evolution which is observed in
the F and pCU1 plasmids
(Chattoraj.Schneider1997.
The block of conservation around the CCC,
3 bases on the 5' side and 3 bases on teh 3' side,
suggests assignment
of the middle C at +14 to be the center of the major groove,
represented as the peak of a sine wave with wavelength 10.6
bases. With that assignment, the TGT is exactly in the major
groove, just as in RepA.
This places an A at position +8 exactly into the center
of the minor groove.
The point of these examples is not to discourage people from using flat logos, but rather to show that there is a risk in missing important biological phenomena if the conservation of the binding site is not presented to the user quantitatively using the standard sequence logo.
Examples of "flat" logos:
@article{Jager.Schmitz2009,
author = "D. Jager
 and C. M. Sharma
 and J. Thomsen
 and C. Ehlers
 and J. Vogel
 and R. A. Schmitz",
title = "{Deep sequencing analysis of the \emph{Methanosarcina
mazei} G\"{o}1 transcriptome in response to nitrogen availability}",
journal = "Proc. Natl. Acad. Sci. USA",
volume = "106",
pages = "21878--21882",
pmid = "19996181",
pmcid = "PMC2799843",
comment = "2013/03/05 15:24:00",
year = "2009"}
Reference,Figure with legend, Image (jpg)
Differences in microRNA detection levels are technology and sequence dependent. Leshkowitz D, Horn-Saban S, Parmet Y, Feldmesser E. RNA. 2013 Feb 19. [Epub ahead of print] PMID: 23431331
@article{Humphreys.Preiss2012,
author = "D. T. Humphreys
 and C. J. Hynes
 and H. R. Patel
 and G. H. Wei
 and L. Cannon
 and D. Fatkin
 and C. M. Suter
 and J. L. Clancy
 and T. Preiss",
title = "{Complexity of murine cardiomyocyte miRNA biogenesis,
sequence variant expression and function}",
journal = "PLoS One",
volume = "7",
pages = "e30933",
pmid = "22319597",
pmcid = "PMC3272019",
year = "2012"}
@article{Chou.Schwartz2011, author = "M. F. Chou and D. Schwartz", title = "{Biological sequence motif discovery using motif-x}", journal = "Curr Protoc Bioinformatics", volume = "Chapter 13", pages = "Unit 13.15--24", pmid = "21901740", year = "2011"}@article{Oman.vanderDonk2010, author = "T. J. Oman and W. A. {van der Donk}", title = "{Follow the leader: the use of leader peptides to guide natural product biosynthesis}", journal = "Nat Chem Biol", volume = "6", pages = "9--18", pmid = "20016494", pmcid = "PMC3799897", year = "2010"} Figure 2@article{Viola.Gonzalez2012, author = "I. L. Viola and R. Reinheimer and R. Ripoll and N. G. Manassero and D. H. Gonzalez", title = "{Determinants of the DNA binding specificity of class I and class II TCP transcription factors}", journal = "J Biol Chem", volume = "287", pages = "347--356", pmid = "22074922", pmcid = "PMC3249086", year = "2012"} Figure 1@article{Ugolev.Schuldiner2013, author = "Y. Ugolev and T. Segal and D. Yaffe and Y. Gros and S. Schuldiner", title = "{Identification of conformationally sensitive residues essential for inhibition of vesicular monoamine transport by the noncompetitive inhibitor tetrabenazine}", journal = "J Biol Chem", volume = "288", pages = "32160--32171", pmid = "24062308", pmcid = "PMC3820856", year = "2013"} Figure 4 and Figure 6@article{Ranjani.Goh2014, author = "V. Ranjani and S. Janecek and K. P. Chai and S. Shahir and R. N. {Abdul Rahman} and K. G. Chan and K. M. Goh", title = "{Protein engineering of selected residues from conserved sequence regions of a novel Anoxybacillus alpha-amylase}", journal = "Sci Rep", volume = "4", pages = "5850", pmid = "25069018", year = "2014"} Figure 1@article{Borrok.Tsui2015, author = "M. J. Borrok and Y. Wu and N. Beyaz and X. Q. Yu and V. Oganesyan and W. F. Dall'Acqua and P. Tsui", title = "{pH-dependent Binding Engineering Reveals an FcRn Affinity Threshold That Governs IgG Recycling}", journal = "J Biol Chem", volume = "290", pages = "4282--4290", pmid = "25538249", pmcid = "PMC4326836", comment = "2015/03/14 17:04:41 ", year = "2015"}Figure 3.- Introduction to Computational and Systems Biology, MIT OpenCourseWare, Modeling Biological Function teaches flat logos which could prevent students from making discoveries. The course is part of Foundations of Computational and Systems Biology.
@article{Jolma.Taipale2013, author = "A. Jolma and J. Yan and T. Whitington and J. Toivonen and K. R. Nitta and P. Rastas and E. Morgunova and M. Enge and M. Taipale and G. Wei and K. Palin and J. M. Vaquerizas and R. Vincentelli and N. M. Luscombe and T. R. Hughes and P. Lemaire and E. Ukkonen and T. Kivioja and J. Taipale", title = "{DNA-binding specificities of human transcription factors}", journal = "Cell", volume = "152", pages = "327--339", pmid = "3332764", year = "2013"}- pmcid = "PMC1664720"
- pubmed = "23422071"
- pubmed = "26236937"
- Analysis of 51 cyclodipeptide synthases reveals the basis for substrate specificity
- pubmed = "26228149"
- pubmed = "22973496"
- pubmed = "25765849"
- http://bat.infspire.org/research/immunogenetics/index.html
- pubmed = "26550823"
- pubmed = "26842708"
- pubmed = "26550823"
- Isolation and sequence analysis of pCS36-4CPA, a small plasmid from Citrobacter sp. 36-4CPA
- pubmed = "27013733"
- pubmed = "26506369"
- pubmed = "27199429"
- pubmed = "27659002"
- pubmed = "27376239"
- pubmed = "27814978"
- pubmed = "27805055"
- pubmed = "16478204"
- pubmed = "27990613" Figure 6
- pubmed = "27281207" Figure 4d
- http://www.sciencedirect.com/science/article/pii/S014341601630210X Figure 1
- pubmed = "28134931" Sahakyan et al. Supplementary Figure 1
- pubmed = "28655774" Vernon et al. Figure 1
- Barbot.Beswick2017 (doi) Page 161, figure 10.3b.
- pubmed = "28473536" Many figures!
- pubmed = "28108474" Flat logos AND no zero coordinate when they finally do the information logo! Also, they are thinking consensus sequences are normal sites.
- pubmed = "27614075" Flat logo in figure 5
- pubmed = "29154940" Flat logo in figure 3e.
- pubmed = "29215568" Flat logo in figure 1.
- pubmed = "29304472" The bacteriophage D6 iterons were reported as a consensus, missing the flipping base!
- pubmed = "29307492" Figure S5 is a flat probability logo. "https://doi.org/10.1016/j.cell.2017.12.009
- Modular discovery of monomeric and dimeric transcription factor binding motifs for large data sets "https://academic.oup.com/nar/advance-article/doi/10.1093/nar/gky027/4827086 jarkko.toivonen@cs.helsinki.fi esko.ukkonen@helsinki.fi Drs. Jarkko Toivonen and Esko Ukkonen: Many figures!
- pubmed = "https://www.ncbi.nlm.nih.gov/pubmed/20517297 Wei GH, Badis G, Berger MF, Kivioja T, Palin K, Enge M, Bonke M, Jolma A, Varjosalo M, Gehrke AR, Yan J, Talukder S, Turunen M, Taipale M, Stunnenberg HG, Ukkonen E, Hughes TR, Bulyk ML, Taipale J.
- pubmed = "https://www.ncbi.nlm.nih.gov/pubmed/23919388 Giaquinta E1, Grabowski S, Ukkonen E.
- pubmed = "29386122" Figure 2 has many flat logos. https://doi.org/10.1016/j.jprot.2018.01.014
- pubmed = "29361968" Figures 2, 3 and 5 show flat logos. https://doi.org/10.1186/s13059-018-1389-1
- pubmed = "25978676" Figure 4 shows flat logos. https://doi.org/10.1371/journal.pone.0126590
- pubmed = "30243843" The graphical abstract and figure 3 show flat logos. Figure 3 also shows an undefined 'Ci Vector' on a scale of 0 to 100 that appears to be sequence conservation using a poor method. https://doi.org/10.1016/j.taap.2018.09.013
- pubmed = "25657251" Figue 3G, 4H, 4E. https://doi.org/10.1126/science.1257360
- pubmed = "30837338" Figure S3B. https://doi.org/10.1128/mBio.02492-18
- pubmed = "30938447" Figure 4. https://doi.org/10.1093/jxb/erz127
- pubmed = "30938447" Figure S3. https://doi.org/10.1073/pnas.1512995112 Flat logos are created the HOMER motif finder.
- pubmed = "31384992" Figure 3. https://doi.org/10.1007/s00253-019-10047-2
- pubmed = "31587991"
- pubmed = "31142587" Figure 3a.
- pubmed = "22397991" Figure 1.
 References:
So that your paper can be tracked
in the literature,
please cite the
original reference:
References:
So that your paper can be tracked
in the literature,
please cite the
original reference:
@article{Schneider.Stephens1990,
author = "T. D. Schneider
 and R. M. Stephens",
title = "Sequence Logos: A New Way to Display Consensus Sequences",
journal = "Nucleic Acids Res.",
volume = "18",
pages = "6097--6100",
pmid = "2172928",
pmcid = "PMC332411",
note = "\htmladdnormallink
{http://dx.doi.org/10.1093/nar/18.20.6097}
{http://dx.doi.org/10.1093/nar/18.20.6097},
\htmladdnormallink
{https://alum.mit.edu/www/toms/papers/logopaper/}
{https://alum.mit.edu/www/toms/papers/logopaper/}",
year = "1990"}
- Keep the word 'bits' on the logo. Bits are a unit of measure with a precise thermodynamic relationship to energy.
- Bits are not scores! You cannot just multiply bits by an arbitrary scaling constant and still have bits. This is because bits are related to energy by the second law of thermodynamics. If you change the scale, you will wreck this important thermodynamic relationship.
- Report the alignment you used so that others can reproduce your logo!
- Give the exact source of each sequence (GenBank Accession number and version)
- Give the exact coordinates you used. Do not make your reader depend on the sequence to locate the sites. We have had cases where the given sequences in E. coli were ambiguous. This prevented us from extracting and analyzing the sequences ourselves to analyze ranges around the site larger than initially provided.
- Do not give partial sequences or variable length sequences (unless the sequence does not exist, as on the 5' end of an mRNA). That is, don't embed your model of the sites into the reporting of the alignment.
- A simple but precise way to express aligned sequences is with Delila instructions.
- oxyr - Reading of DNA Sequence Logos: Prediction of Major Groove Binding by Information Theory. See also How To Read Sequence Logos.
- baseflip - Bases that do not match the sine wave can represent abnormal structures or base flipping.
- repan3 - An experiment that suggests DNA base flipping by the bacteriophage P1 repA protein
- flexrbs - Ribosome binding sites in E. coli have a region 5' to the initiation codon, the Shine-Dalgarno (SD), that base pairs to the 3' end of the 16S rRNA forming a helix. The logo of the SD appears to follow a sine wave, implying a helical structure.
- flexprom - The sigma70 subunit of E. coli RNA polymerase can can be aligned at the -35 region to a co-crystal structure. This allows determination of the face of the DNA where the -10 contacts the polymerase and reveals a base that is probably flipping out of the DNA at transcriptional initiation.
 Avoid consensus sequences:
Despite the implication of the title of the original paper,
sequence logos are NOT consensus sequences!
Note that one can not only read the consensus sequence (most frequent
base at every position) from the top of the logo but
one can also read the anti-consensus sequence (least frequent
base at every position) from the bottom of the logo.
One can also read everything in between.
So logos, in themselves, to not represent a consensus
and it is inappropriate to call a logo a `consensus'.
See the paper
Consensus Sequence Zen.
Avoid consensus sequences:
Despite the implication of the title of the original paper,
sequence logos are NOT consensus sequences!
Note that one can not only read the consensus sequence (most frequent
base at every position) from the top of the logo but
one can also read the anti-consensus sequence (least frequent
base at every position) from the bottom of the logo.
One can also read everything in between.
So logos, in themselves, to not represent a consensus
and it is inappropriate to call a logo a `consensus'.
See the paper
Consensus Sequence Zen.
 Publish the raw sequence data used to make the logo.
This allows others to reconstruct your sequence logo and to make
computations on it.
Give the sources of the data. This can be supplementary material
or made available on the web.
Publish the raw sequence data used to make the logo.
This allows others to reconstruct your sequence logo and to make
computations on it.
Give the sources of the data. This can be supplementary material
or made available on the web.
- Using natural log on the y axis simply makes thinking about the results more difficult. See the Information Theory Primer appendix which shows how to do logarithms in your head by using base 2.
- Putting any energy units on the y axis would be a mistake unless you know the efficiency. Energy and information are different things. The easiest way to see this is to note that a coin can store exactly one bit of information. But a coin held above a table that might be flipping has both potential and kinetic energy. That energy must be dissipated to set the coin down as heads or tails. The amount dissipated can vary, but the minimum is determined by the second law of thermodynamics. So there is an inequality relationship between energy and information and to put an energy scale on a logo generated from symbols is incorrect.
For example, two papers on malarial proteins were published back-to-back in Science in which sequence logos were given for similar data. One paper (Hiller.Haldar2004) apparently used relative entropy and so showed an impossible amount of sequence conservation, near 5 bits for the 20 amino acids. To chose one object in 20 never takes more than log220 = 4.3 bits, see their Figure 2. The other paper (Marti.Cowman2004) did not cite the source of their method but it was presumably the original logo paper since the height of a fully conserved position is around 4.3 bits, see their Figure 1, and so the two logos show inconsistent heights. A reader could be left puzzled by the discrepancy. (Note also the lack of error bars on the figures.)
@article{Marti.Cowman2004,
author = "M. Marti
 and R. T. Good
 and M. Rug
 and E. Knuepfer
 and A. F. Cowman",
title = "{Targeting malaria virulence and remodeling proteins to
the host erythrocyte}",
journal = "Science",
volume = "306",
pages = "1930--1933",
pmid = "15591202",
year = "2004"}

@article{Hiller.Haldar2004,
author = "N. L. Hiller
 and S. Bhattacharjee
 and C. {van Ooij}
 and K. Liolios
 and T. Harrison
 and C. Lopez-Estrano
 and K. Haldar",
title = "{A host-targeting signal in virulence proteins reveals a
secretome in malarial infection}",
journal = "Science",
volume = "306",
pages = "1934--1937",
pmid = "15591203",
year = "2004"}
- The total information is significant (Schneider1986, ev).
- The patterns of base use give clues to the mechanism of DNA binding (helixrepa).
- Sine waves on a DNA logo predict the face of DNA being bound or show anomalies such as base flipping (see references above).
- Use information theory to look at individual sites using (sequence walkers). Because it is based on information theory, method has the advantage that the second law of thermodynamics provides a natual cutoff for the results, which are in bits for all systems.
- Compare the total information to the binding energy to determine the isothermal efficiency (emmgeo).
- Avoid other pitfalls in information theory and molecular information theory.