head of Tyrannosaurus Rex ev: Evolution of Biological Information,
Things to do in Evj

In approximate decreasing order of importance:
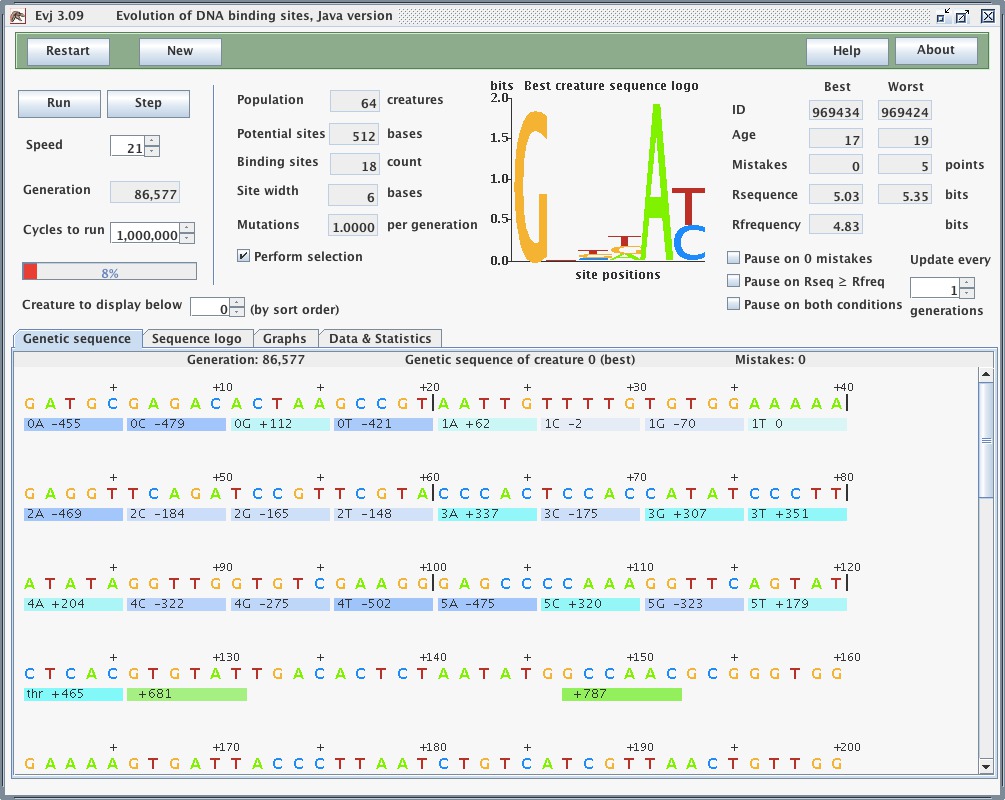
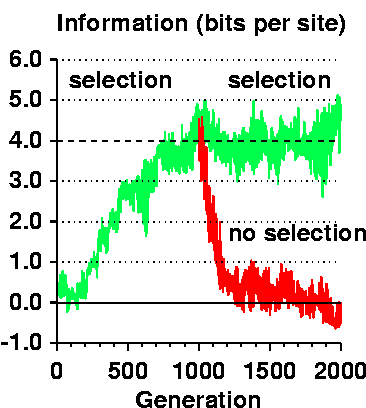
  1. Logo letters not correct heights. In this example the A and G are not equal heights, though they should be since they both are fully conserved. The A is slightly higher than the G. I was able to replicate the result by setting: (Click on the image to show the jpg.) Figure 2 of the paper Evolution of Biological Information showing
information (bits per site) ranging from -1.0 to 6.0 bits versus
Generation running from0 to 2000.  A dashed line at 4.0 bits is
Rfrequency.  The evolution of the binding sites is shown by a green
curve that starts near zero bits and evolves to around 4.0 bits by
1000 generations and then oscillates there around 4 bits.  Selection
covers this entire range.  A second red curve starts again at 1000
without selection.  The red curve decays exponenentially to near zero
bits.
  2. Rs/Rf graph. Graph Rsequence versus generations with a line across the graph for Rfrequency.
  3. Creature ID and creature display numbers not consistent. When one starts the program, "Creature to display below" shows '0'. At the same time 'Genetic sequence of creature 0' is shown. However, in the upper right the ID runs from 1 to 64. There seems to be an inconsistency in numbering creatures. Indeed, when I increase the "Creature to display below" it maxes out at 63. So displayable creatures run from 0 to 63 but the ID numbers run from 1 to 64.
  4. Run Java Apps on iOS and Android. Article Java Apps on iOS and Android - Now a Reality by Shay Shmeltzer. ORACLE.COM/JAVAMAGAZINE SEPTEMBER/OCTOBER 2014 pages 43-46.
  5. Initial Window Size. Make display window open to a size so the entire standard genome is visible. This way I won't have to keep adjusting it every time I show someone the program, and users won't have to figure out even that it can be adjustable to see the whole genome.
    Method to find window size relative to Terminal size:
    Use Terminal and match it to a Evj window while running this script:
    while (1)
    echo;echo -n 'lines: '; tput lines ; echo -n 'columns:' ; tput columns; sleep 1
    end
    
    ---
    RESULT: 
    lines: 46 columns:104
    New as of 2014 Oct 21.
  6. Add to control panel: A button to 'Pause on Mistakes Going Down' would be useful! There's room on the display for that.
  7. Add to control panel: 'Potential Sites (G)' and 'Binding Sites ($\gamma$)'
  8. Add to control panel (2016 Nov 16):
    Number of found actual sites (green)
    Number of missed actual sites (red)
    Number of incorrectly identified sites (yellow)
  9. Show Rfrequency in the New panel. This way someone can tell that the settings for genome and number of sites are ok. For example, one might want an integer for Rfrequency and this would help.
    Alternatively update Rfrequency on the main panel as the values are changed on the New panel. This is probably a better solution, though more subtle.
    Paul points out: "Ooh, that's a bear. The New dialog is in control and it's difficult to change the main panel. Also, the user may cancel the New dialog and then you'd have to undo the changes."
  10. Example parameters.
    • Standard example
    • Standard example with doubled genome:
      • Potential sites 1024 bases
      • Binding sites 64 bases
      • Site width 10 bases
      This gives an Rf of 4.00 but should have a tighter Rs/generations graph
    new as of 2010 May 01
  11. BUG: Help doesn't do anything 2005 Oct 13. Pete Lemkin: "When I clicked on HELP nothing happened. We link our help pages on the server by invokving a popup web brower to specific server pages from the Java code." You can get our code to do this here. There are examples of how this is called in many of our programs, but here is an instance.
  12. 2005 Oct 26, TDS: Timer: total time of the run so far.
  13. 2005 Oct 15, Pete Lemkin: What would be useful would be to have another web page where you would show a series of screen shots they could look at before or after they run it - each of which has nice descriptive legend that shows the context of what this step/result is.
  14. Rsequence is computed twice - once for the Rs display and once for the logo. Make it a single function for efficiency.
  15. Fancy Logo in a tab Is this really needed or useful? One can't watch it and the genome at the same time! Maybe separable windows would be better.
  16. Mistakes graph in a tab
  17. When one does New and asks for more sites than can fit into the genome, a message comes up. However, if the sites are allowed to overlap there should be no message - it should be possible to put them in as long as G > = gamma. (That is, sites must be in distinct locations.)
  18. generations per second. Make an option to have the display update at a certain frequency. Paul thinks this is not easy to do.
  19. Logo gallery in a tab. Sequence logos from the sites are recorded every so-many generations and displayed as a gallery. Alternatively, the images are collected as a movie.
  20. Logo of whole genome as an option! One would specify the number of previous generations to include. The program would have to capture the frequency data for the whole genome for that many generations, which could be expensive in memory. To change the data every generation, one would need to keep every previous generation (over the desired time interval) so that the bases from the last genome could be removed.

  21. Logo of whole genome: time slice This would show a logo of all organism genomes in the current time slice.

  22. Statistics PA:

    A way to avoid this intense memory use would be to restart the frequency data at zero every so many generations. Once that many generations have passed, display the logo. Then zero and gather for the next. So this would require two genome-length arrays, the current one being displayed and the one being built.

  23. Tighten the boxes for creatures, bases, count bses per gen. We don't need more than 5 decimals there.
  24. We could implement two or three selection algorithms and add a parameter to choose. That would silence the anti-truncation selection crowd. Williams
  25. 2005 Sep 21: Cristi suggested to allow the user to modify the threshold. 2005 Nov 1: One thing is to allow the user to remove the threshold. The other is to allow the user to set the threshold to a specific number (eg zero) that is, of course, not in the genome. I suppose these are the same thing - removing the threshold means that the default is zero.
  26. 2005 Sep 25: logo slider bar. If one makes a really wide logo, the numbers will get crammed. Maybe the logo should have a slider bar. 2005 Nov 1: this probably is too much mechanism to put in the main display logo.
  27. 2005 Sep 28: Rate Mistakes Differently. Make an option to rate mistakes differently for missed sites and binding at the wrong sites. Normally both of these are set to 1. Make two variables (integers) and allow the user to set them. Interestingly one could allow zero or negative values ... but normally they would be positive. For counting mistakes, there could also be a distinction made between binding in the gene region and outside the gene region. That could be implemented by splitting binding in the wrong sites into two parameters, one for inside and one for outside the gene region. So there would be three integer parameters for mistakes: inside the gene, outside the gene but not in sites, outside the gene but in sites. These are all '1' now so that would be the default values. Summary: three mistake values:
  28. 2005 Sep 25: Provide some examples: (It's so easy to do I'm not sure this is necessary at all.)
  29. 2005 Nov 28: Super Controller

    Paul: Support for variable mistake points is included.

    Tom: Oh my!!! I set missed site to be 10 and the other to be 1 and it evolved in only 316 generations instead of 700 or so! (actual number: 662)

    Paul: Yes, isn't that cool?

    Tom: Very. It makes me think of a higher level of programming. I'm not sure how this would work but suppose that I wanted to try a range of variable mistake points. Doing this by hand would be tricky. The old Ev in Pascal lets one call the thing in a loop, as I did a few days ago to answer a question you raised.

    So suppose that the user could request a range of values of some parameter. The user would specify number of repeats using different values of the random number generator. So the super controller would run through that parameter, repeating each several times. For example, the time to the first perfect creature would be on the y axis and the site weight on the x axis. This would let someone do a real experiment and plot the result automatically.

    This might be a pretty big change from where things are now, but it would allow more questions to be answered easily.

  30. 2005 Nov 28: Paul: command line mode for Evj. Then you could use it to run experiments from scripts.
  31. 2006 May 30: Tom: Bug in New set up: Allow any number of sites when they overlap randomly. In version Evj 2.21.
  32. 2006 Jun 9: Suggested by Alan Klein: count crossings of Rs with Rf and stop at some number of them. "Agreed. I don't think that the first time Rs > Rf is a good value to use. Even though everyone would get the same values for any particular case, The variation of Rs > Rf from one case to the next is not a good measure of convergence of the solutions. When Rs starts to oscillate around Rf, I would take this as convergence. The only plot I have seen of Rs is from the one case in the ev paper. 5 or 10 oscillations of Rs around Rf may be enough to define convergence. Much more sophisticated mathematical analysis of the Rs curve can be done but will probably add a lot of computer processing time. Keeping track of oscillations of Rs around Rf will only require a simple counter in the program."
    [2006 Jun 9] Pseudo code by Tom for this:
    crossingcounter := 0;
    crossinglimit := (from user);
    AboveRf := false;
    compute Rf;
    /* start the main loop */
    while (otherlimits) and (crossingcounter <= crossinglimit) {
      (compute Rs)
      if ((Rf > Rs) and (not AboveRf))
         or
         ((Rf < Rs) and (    AboveRf))
      then {
          crossingcounter := crossingcounter + 1;
          AboveRf := not AboveRf
      }
    }
    
  33. 2006 Jun 11: Factors not in Evj, Tom and Paul:

  34. 2006 Jun 11: Evj control program. Tom: A control program could be built that sets parameters instead of a person. It would allow experiments to be done more easily by stepping a defined loop that controlled variables. It is possible with the original Ev, but it's hard with the Evj interface. The output should be at minimum cut and pastable, better would be to be able to write it to a file for further analysis. An alternative is to allow calling Evj from the command line but then most people would not do the experiments.

  35. 2006 Jun 19: Tom: Provide mechanism to keep the 'new' panel up all the time. This should make experimentation easier since the user wouldn't have to keep bringing it up all time.

  36. 2006 Jun 20: Display message for refusal to accept a New parameter
    Alan Klein: I click the "ok" button on the form to create a new model. The performance icon from the task manager goes to 100% for about 1 second then goes back to it's base cpu usage level and the form doesn't close. All the other entry fields and buttons work but it won't accept the large population values. If I reduce the population down, the "ok" button works again, the form closes and you can run those values in ev. No error message is displayed and the mouse cursor stays as an arrow. If the program is doing internal processing such as loading data into memory or using a disk swap file, perhaps you could change the mouse pointer to the hour glass.

    Tom: Confirmed. In New, if you set very large population values, (eg 100,000 creatures) then when one clicks OK, the cpu maxes out (as observed with top under unix for example) and the New panel does not go away.

    Paul: I believe if you watch your Java console, you will see:

    Java.lang.OutOfMemoryError: Java heap space
    
    I may be able to catch that error and display a more reasonable message.

  37. 2018 May 21: Switch for two's complement to binary evaluation
    Ev and evj use two's complement notation for the evaluation. This should not be essential, so a switch to binary (with a higher threshold) or other methods (what?) should still give the same evolutionary results.

  38. 2020 May 18 Update Tom's website inside the About for evj to be 'https://alum.mit.edu/www/toms/papers/ev'
  39. 2020 May 21 google: can you run java on a cell phone iOS to be 'can you run java on a cell phone iOS'
  40. HOLD: make tooltip background color lighter to be more easy to read - not technically easy.

Completed:

  1. Logo in control region.
  2. Rsequence DONE!
  3. In the control pannel, under Mutations, change 'gen.' to be 'generations'.
  4. BUG: On the right side of the display, there need to be tooltips for EVERYTHING. Missing: ID, Mistakes, Rsequence, Rfrequency, Best, Worst, count, bits, bits. 2005 Oct 13. Done 2005 oct 6 version 2.02
  5. BUG: Users are puzzled by the absense of anything in the unused tabs: Sequence logo, graphs, Data sheet. At minimum, PUT A MESSAGE ON THE SCREEN THAT IT IS NOT IMPLEMENTED! Tooltips are NOT sufficient because people don't always use them! 2005 Oct 13. revised to reflect new tab names 2005 Oct 26 2005 Oct 28: 2.03 resolved by putting messages on the screen.
  6. Make initial display big enough to show entire genome. (probably forget this?) Yes. Forget it - 2005 Nov 1
  7. Remove right side stuff to get 600x800 display field?
    1. drop ID? (2005 Nov 1: no, it is useful sometimes!)
    2. Move Rsequence to under Rfrequency, drop worst case one. (Done as of 2005 Sep 25)
    3. where should mistakes go? (Done as of 2005 Sep 25)
  8. 2005 Oct 26, TDS: More limits for stopping the program. Right now it halts when the Generation reaches Cycles to run. But it would be useful to have it stop when mistakes = 0 [Done by version 2.21] or Rsequence > Rfrequency. (new on June 1)
  9. 2006 Jun 1: Pause the first time that Rs ≥ Rf. It can be another click box below 'pause on perfect creature'. [done on 2006 Jun 10 version 2.22]
  10. 2006 Jun 10: On the display and in New, change '>=' to a greater than symbol. [done on 2006 Jun 10 version 2.30]
  11. 2006 Jun 10: Statistics of Death TDS:

    People seem to have a hard time visualizing the horrific number of deaths that occur during an Ev run. Maybe a counter 'Number of deaths' under the logo would emphasize it? It would be reset to zero when things are restarted.

    Obviously 50% of the population dies every generation. If there are 64 creatures and lesee ... 675 generations to Rs >= Rf :-) :-) a reproducible result! :-) then 32*675=21600 creatures died to get 4 bits of information per site - with 16 sites that is 64 bits or MORE (you've seen 68%): roughly 337 deaths per bit. Given that each selection removes half of the population, it COULD HAVE done 337 bits. So it is extremely inefficient, 1/337 = 0.3%.

    Another statistic that might be more enlightening would only count deaths IF mistakes is > 0. That is, once the system stabilizes with Rs~Rf, many deaths are just luck of the draw. The creature happened to be below the line but had no mistakes. Tough luck! But if mistakes > 0 the creature can die because it is selected against.

    So we could have:

      deaths
      deaths by mistake
    
    The problem when people look at a beautiful living thing like a tree is that they don't notice the stunted ones near by, the seeds that didn't germinate, the ones that crashed over in a storm. Deaths are often invisible. By putting the number on the display, it would not be overlooked.

    Paul: How about counting deaths if the number of mistakes is greater than the worst creature left alive? Then we don't count deaths of creatures who are as good as the ones left alive, but who are dying just by accident.

    Tom: That's not quite right - the worst creature isn't the critical one because that one is not the reason for THIS creature's death.

    Let's see. First, the creature is in the half that dies. The question is: are there any creatures better than that who would be "responsible" for this creature dying?

    So wouldn't the criterion be that there is at least one creature with a number of mistakes fewer than the one that is dying?

    So - determine the mininmum number of mistakes (already done) and if a creature dies AND has more mistakes than this minimum, we count the death.

    The 'horrific' thing will be to see how this keeps on climbing after Rs = Rf or mistakes = 0!

    There can be a graph of death by mistake.

    Paul: But the worst one left alive, the guy just above the midpoint of the sorted list, is no better than the best one killed, if their scores are equal. Which one of those two dies is just a crapshoot.

    But why single out the one with the fewest mistakes? A guy 1/4 of the way down the sorted list is just as responsible for the deaths of the bottom half, but is closer in score.

    This doesn't seem right.

    Tom: Ok, I see. Your suggestion to count death because of having more mistakes than the worst creature left alive is good.

    [done earlier than 2006 Jun 17 version 2.35]

  12. 2006 Jun 11: BOTH Rs ≥ Rf and perfect creature TDS:

    We have the space but it is so important that I think an option for both should be another check box. Maybe the Rs ≥ Rf option alone or the counting option would go onto the New panel later. [done on 2006 Jun 17 version 2.35]

  13. 2006 Jun 17: Mutations per base.

    Tom: Experiments should be done with constant mutations per base. It is UNREASONABLE to increase genome size and simultaneously effectively decrease the mutation rate per base because we know that mutation comes from polymerase copying error and from exposure to mutagens. Both of those are on a per base basis.

    Paul: Good point. What sort of rate should we use? Hey, maybe Evj needs a mutations/base rather than just a fixed number.

    Tom: Yes. The question is how to implement it without it costing a lot.

    Tom: Let's see. Suppose we said 1/256 mutations per base. Then that would be 1 per genome that is 256 long. So we compute 256 * 1/256 ~ 1 and use 1 per genome. This would work for even multiples: 512 * 1/256 ~ 2 per genome. It would be inexpensive to set up. So what do we do if it's not an exact multiple?

    Paul: Round to the nearest integer, I would think. Tom: That would be ok but not the best.

    Tom: Hmm. One way is to do the integer part of the number per genome. Then flip ONE random number for the remaining part. Sure! That's one random number (expensive) per generation and creature. Not too bad compared to one random number per BASE copied! We have (say) 2.2 as our mutations per genome (computed from mutations per base). So we do 2 hits and then flip a random number between 0 and 1. If the random number is between 0 and 0.2, we do another hit, otherwise not. On the long run you get 2.2 hits per genome.

    Paul: That sounds better. Do we specify mutations/base, or > mutations/kilobase so the user doesn't have to specify real numbers?

    Tom: It would be easier on the person to give it as mutations/base. So there would be the original method (hits per genome) and a toggle to get the new methods (hits per base as a real number). Maybe the user would input one over hits per base, so an input of 256 means one hit every 256 bases or 1 hit per genome. NOTE that this method is not going to give the full proper poisson distribution. That's pretty expensive because it has to be done for every base.

    Summary: Provide mutations per base as a real number: "1 in every ______ bases" Compute: m = genome size * mutations / bases. To create mutations in an organism, split m into integer (mi) and decimal (md) parts. Do the integer part of m mutations. Chose a random number r between 0 and 1. If r <= md, do an additional mutation. In this way the requested mutations will be done on average.

    [2006 Jun 19] Paul: Regarding the two methods of determining mutations per genome: When we divide genome size by (1 mutation per) n (bases), do we want to use the potential sites count or the full size of the chromosome (remember, it's padded so a binding site can occur at the end).

    Tom: Tricky! Let's see, in the standard example it's 261 bases long with 256 potential sites.
    Mutations need to go into the 261 bases.
    But if we force the person to think about the extra padding it will be a pain.
    Tentatively let's say the user asks to use one mutation every 256 bases. Then we know the precise rate. That rate applies, of course, to the padding at the end. So the computation would have to be with 261. Suppose that the person says that there should be one mutation every 256 bases and the potential sites are 500 long. Then with 6 site width sites, that's 505. We compute with 505.

    2006 Jun 21: Done in version 2.36.

  14. Show evalutation for initial step! Without the initial step the display doesn't show the sites at first. So I always have to do that to explain it to people. It doesn't have to be an actual step, just make sure that the evaluations are done for the initial display.
    Change planned 2009 Apr 01.
    Done in version 3.07 2010 Apr 26.
  15. No initial sort!! - the initial sort means that there are no cases of yellow colored bars, which makes explanation harder. (That is, the best creature shows up and it only has red cases. We should stick to the same example we have been doing though, for consistency.)
    Change planned 2009 Apr 01.
    Done in version 3.07 2010 Apr 26.
  16. Option to switch to any creature
    Change planned 2009 Apr 01.
    Done in version 3.07 2010 Apr 26.
  17. Missing text. 2010 Apr 26. Open the New panel Done in version 3.08 2010 Apr 30.
  18. Logo title line is too long. 2010 Apr 26. Now that it is bold face, it runs off the end: "Sequence logo of best creatu".
    2010 Apr 30. Revised to "Best creature sequence logo"

color bar Small icon for Theory of Molecular Machines: physics,
chemistry, biology, molecular biology, evolutionary theory,
genetic engineering, sequence logos, information theory,
electrical engineering, thermodynamics, statistical
mechanics, hypersphere packing, gumball machines, Maxwell's
Daemon, limits of computers


Schneider Lab

origin: 2005 Aug 3
updated: 2020 May 21: google: can you run java on a cell phone iOS
color bar