START SLIDE SHOW Launch blank background browser. This should work on any browser but will not give full screen coverage.* Popup blank background browser. This gives full screen coverage but depends on javascript so may not work on all browsers. Click on the link to get this page to begin the slide show.*

1 Rsequence, Rfrequency, Excess Information at
Bacteriophage T7 promoters and the Evolution of Binding
Frederick, Laboratory of Experimental and Computational
Biology, Frederick, MD 21702-1201, toms@alum.mit.edu,
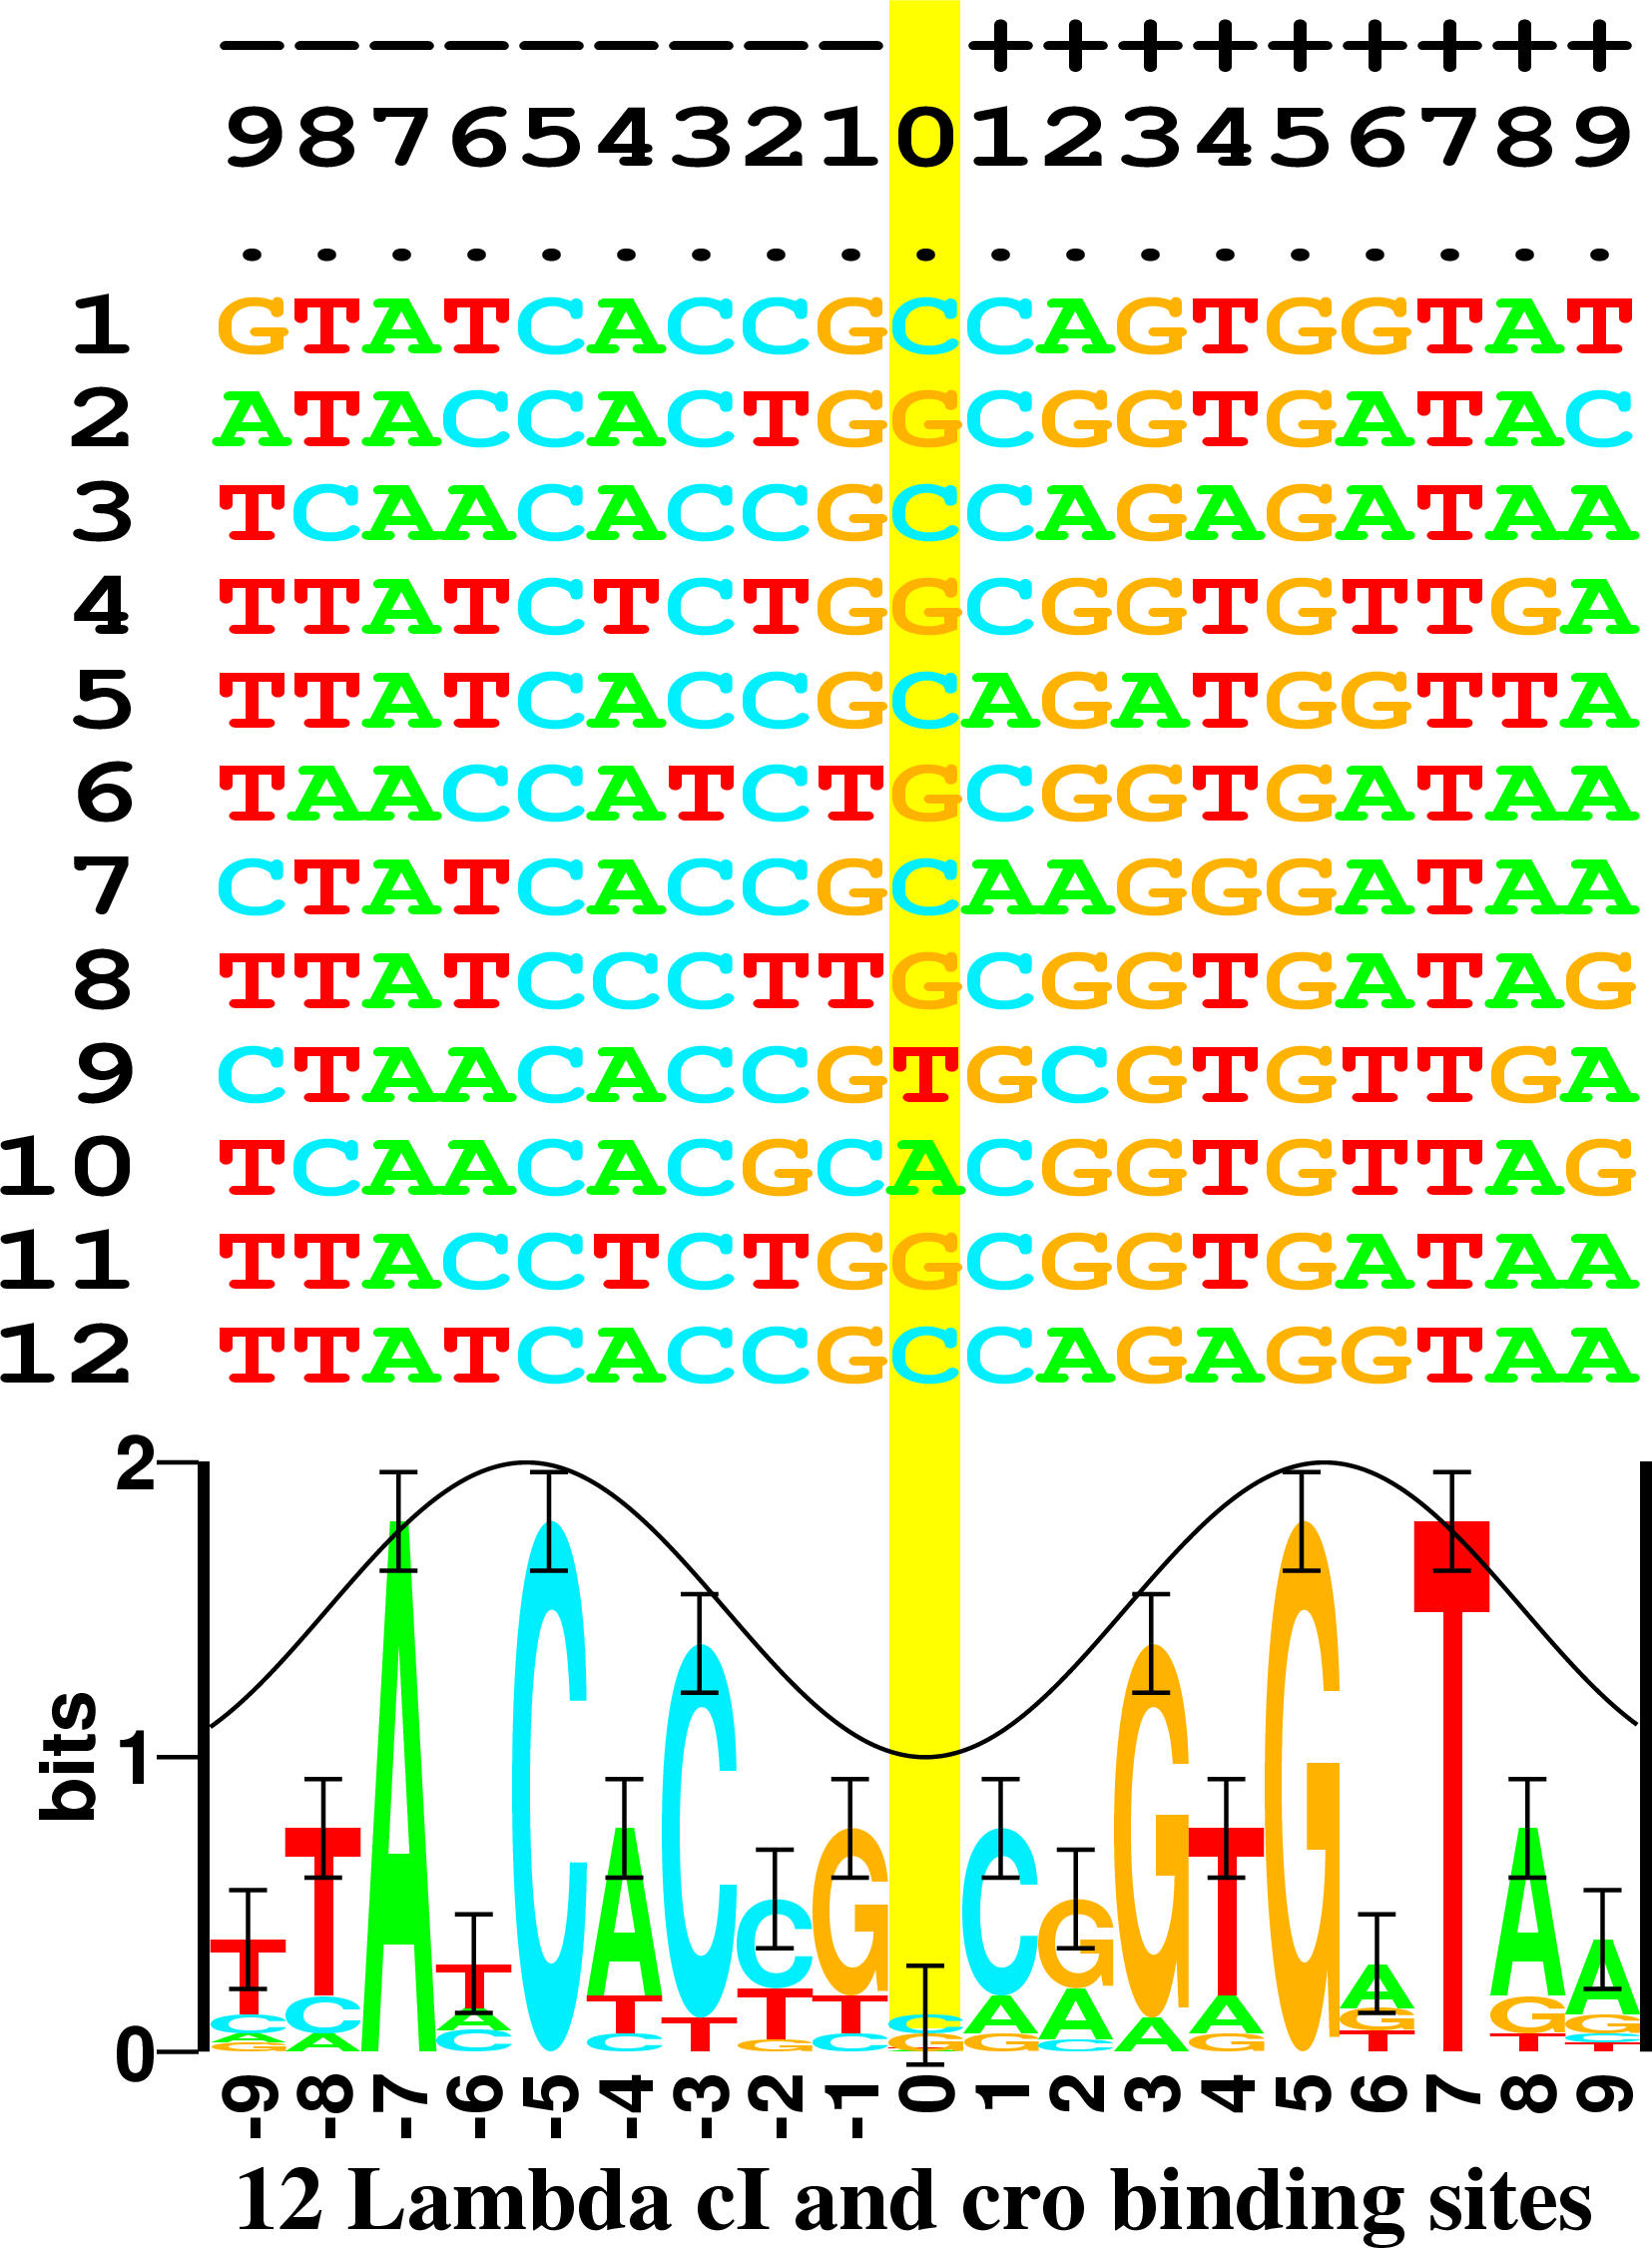
https://alum.mit.edu/www/toms/, www.fred.net/tds/work 2 3 4  Sequence alignment and sequence logo. 12 Lambda cI and
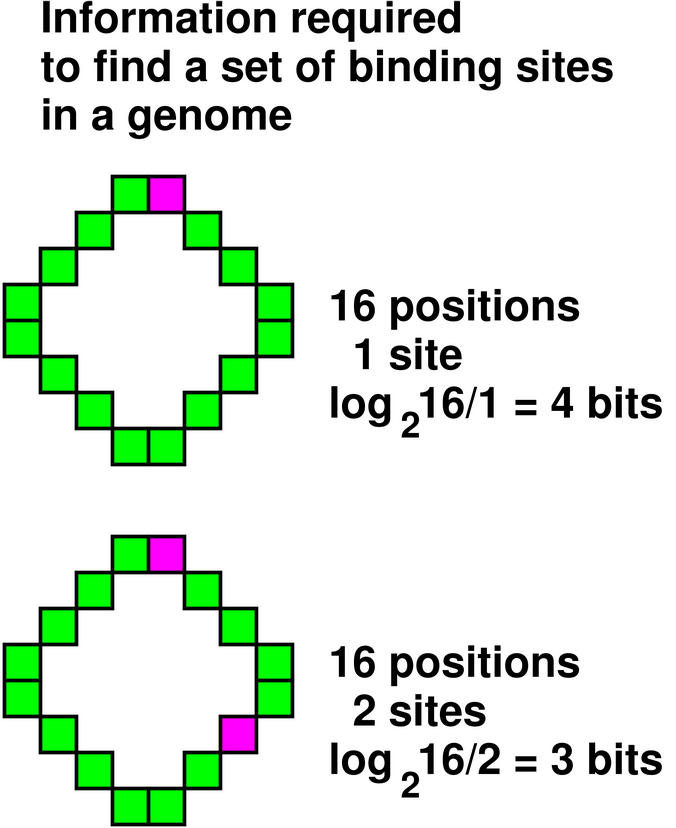
cro binding sites. 5 6  Information required to find a set of binding sites in
a genome 16 positions: 1 site, log2 16/1 = 4 bits. 16
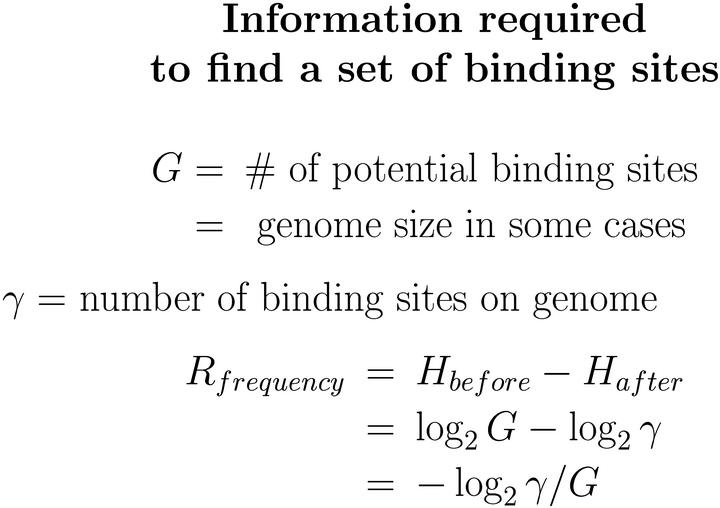
positions: 2 sites, log2 16/2 = 3 bits. 7  Information required to find a set of binding sites. G
= # of potential binding sites = genome size in some cases.
gamma = number of binding sites on genome. Rfrequency =
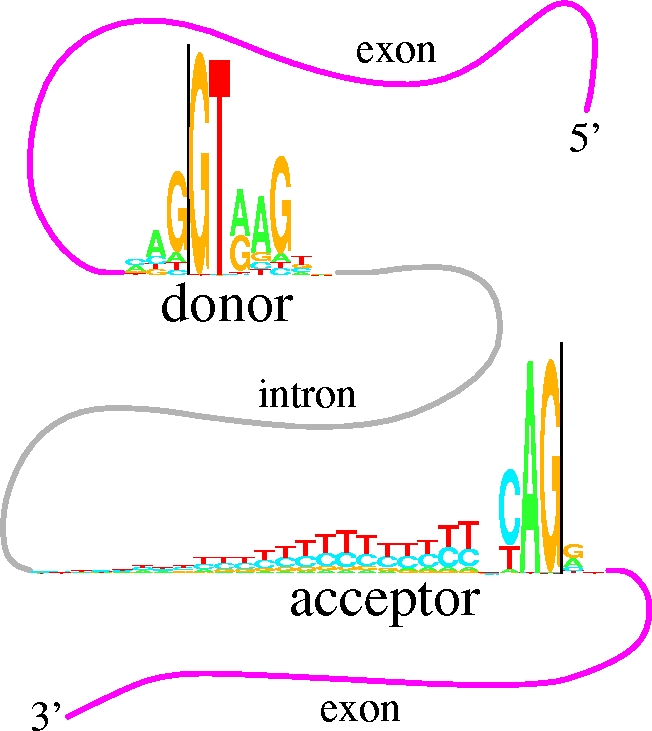
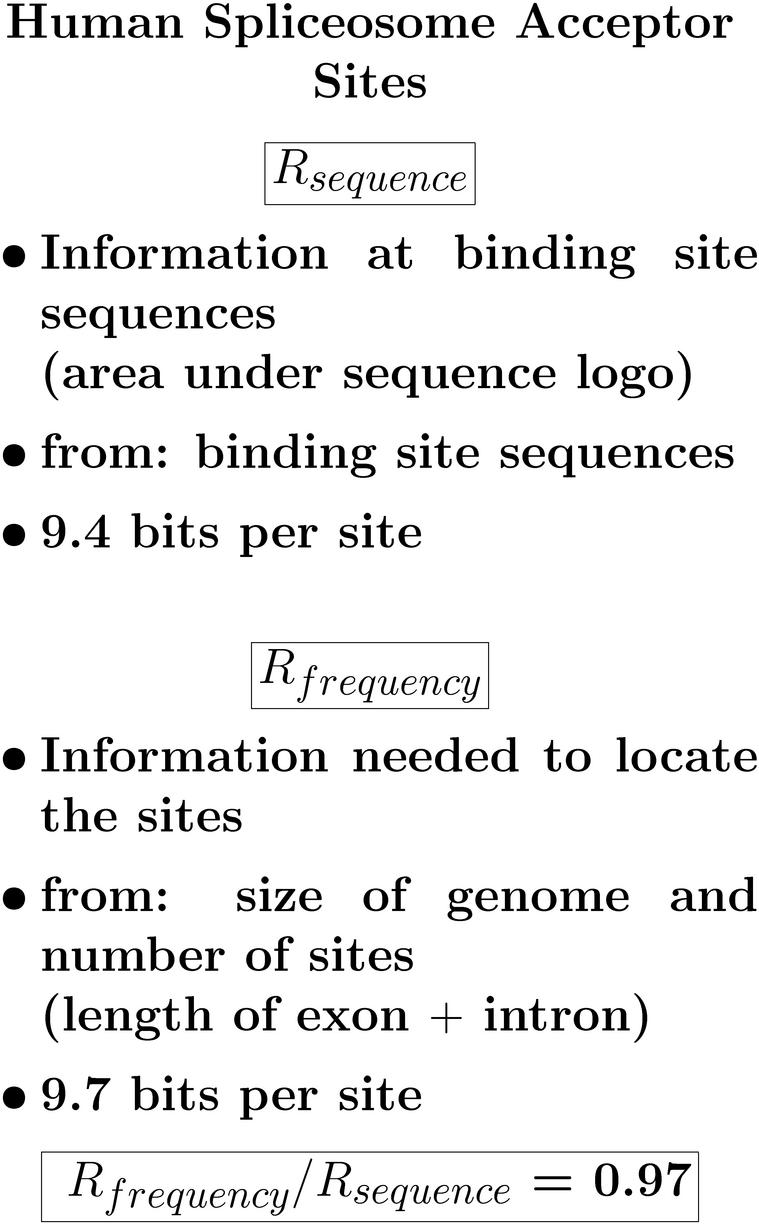
Hbefore = Hafter = log2 G - log2 gamma = -log2 gamma/G. 8  Human Spliceosome Acceptor Sites Rsequence *
Information at binding site sequences (area under sequence
logo) * from: binding site sequences * 9.4 bits per site
Rfrequency * Information needed to locate the sites * from:
size of genome and number of sites (length of exon +
intron) * 9.7 bits per site * Rfrequency / Rsequence = 0.97 9  Hypothesis: The information in binding site patterns is
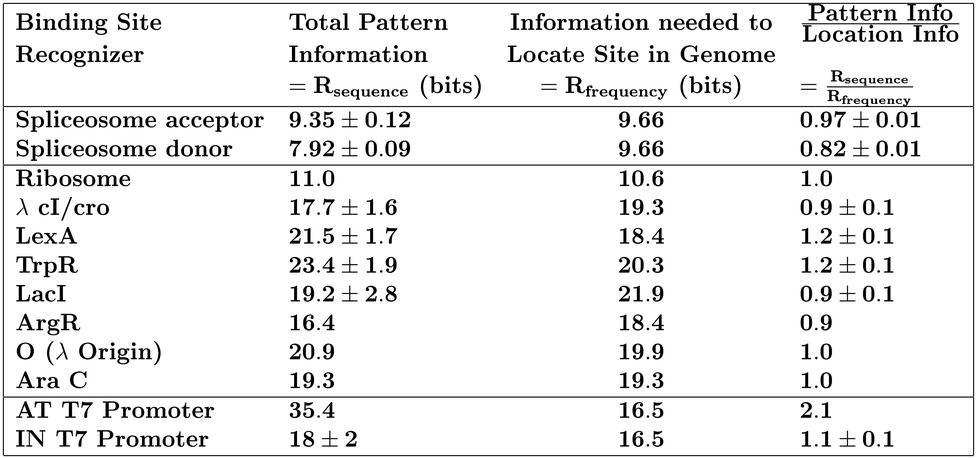
just sufficient for the sites to be found in the genome 10  Table: Binding Site Recognizer Total Pattern
Information = Rsequence (bits) Information needed to Locate
Site in Genome = Rfrequency (bits) Pattern Info Location
Info = Rsequence Rfrequency Spliceosome acceptor 9.35 ±
0.12 9.66 0.97 ± 0.01 Spliceosome donor 7.92 ± 0.09 9.66
0.82 ± 0.01 Ribosome λ cI/cro LexA TrpR LacI ArgR O (λ
Origin) Ara C 11.0 17.7 ± 1.6 21.5 ± 1.7 23.4 ± 1.9 19.2
± 2.8 16.4 20.9 19.3 10.6 1.0 19.3 0.9 ± 0.1 18.4 1.2 ±
0.1 20.3 1.2 ± 0.1 21.9 0.9 ± 0.1 18.4 0.9 19.9 1.0 19.3
1.0 AT T7 Promoter 35.4 16.5 2.1 IN T7 Promoter 18 ± 2
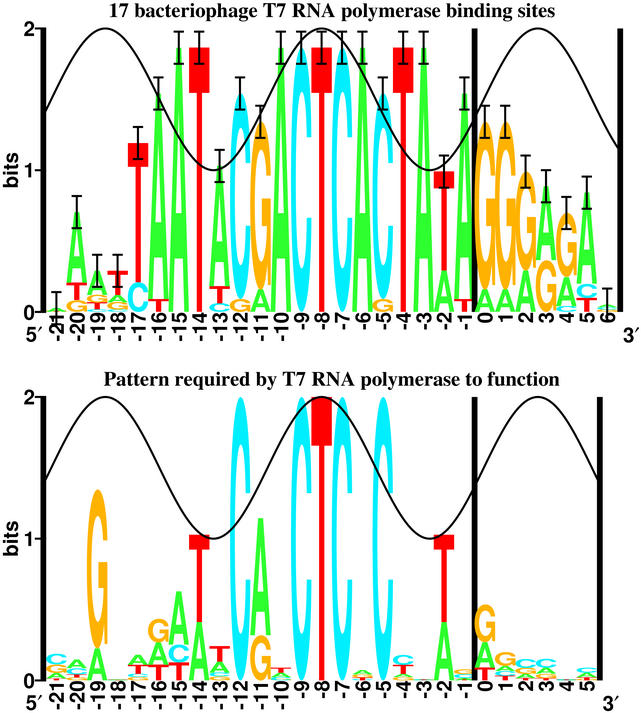
16.5 1.1 ± 0.1 11  Two sequence logos. 17 Bacteriophage T7 RNA polymerase
binding sites (about 35 bits). Pattern required by T7 RnA
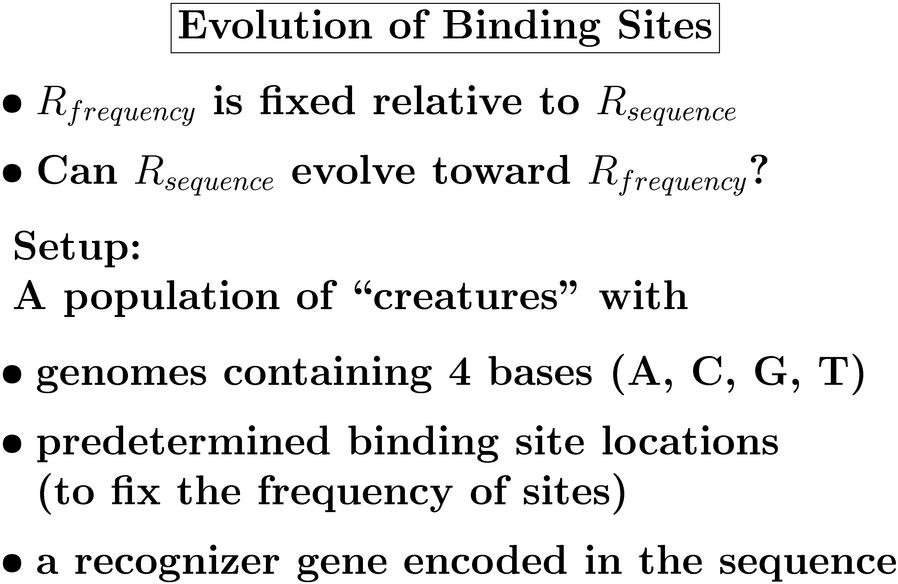
polymerase to function (only 18 bits). 12  Evolution of Binding Sites * Rfrequency is fixed
relative to Rsequence * Can Rsequence evolve toward
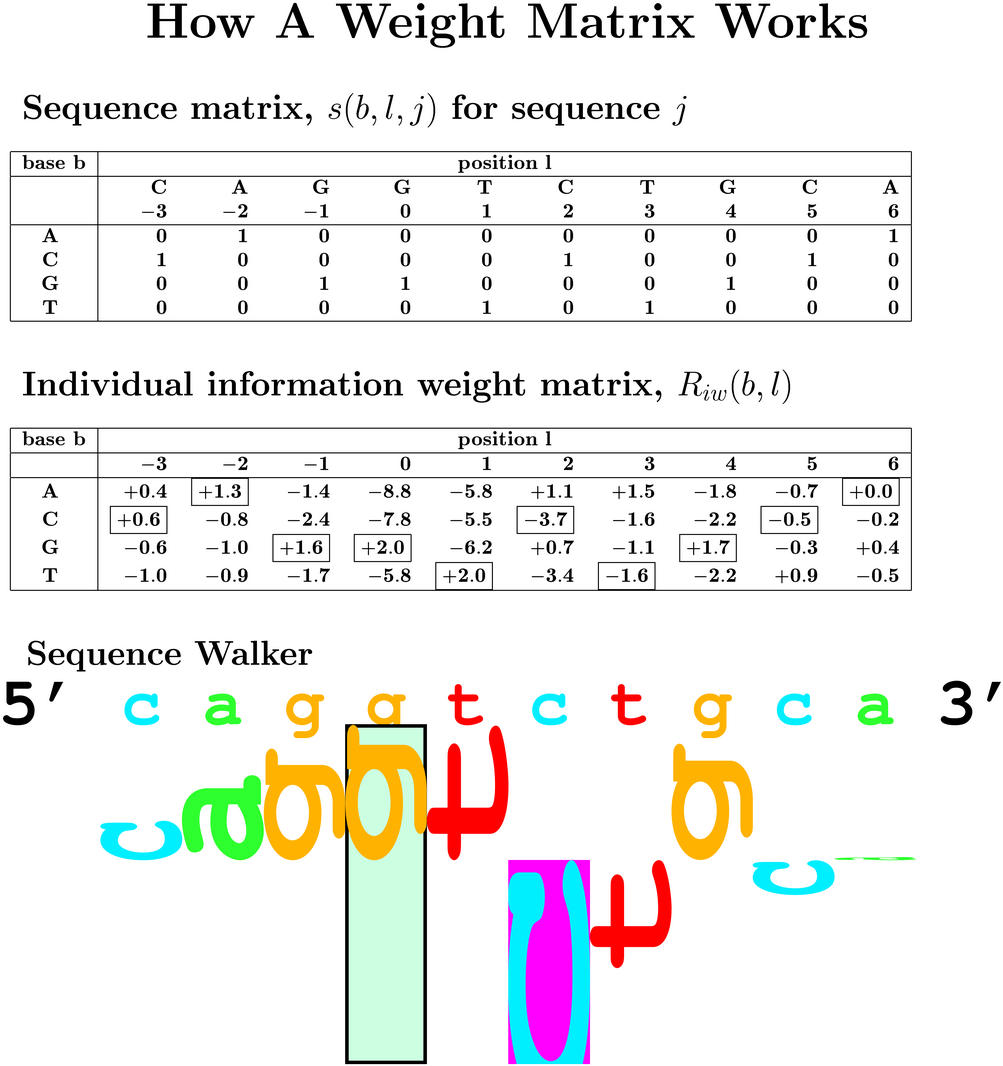
Rfrequency? Setup: A population of 13  How A Weight Matrix Works Sequence matrix, s(b,l,j) for
sequence j has 4 rows (base b: ACGT) and -3 to 6 columns
(position l: CAGGTCTGCA). Each column has 3 zeros and a 1
corrsponding to that base. Individual information weight
matrix, Riw(b,l) has the same form as the sequence matrix
but has positive and negative numbers in it.  Add the
numbers that correspond to 1's in the first matrix to get
the total. Sequence walker - a graphic 5' to 3' showing the
sequence and then the same letters but with heights
corresponding to the individual information weight matrix.
The letters are rotated 90 degrees counterclockwise to
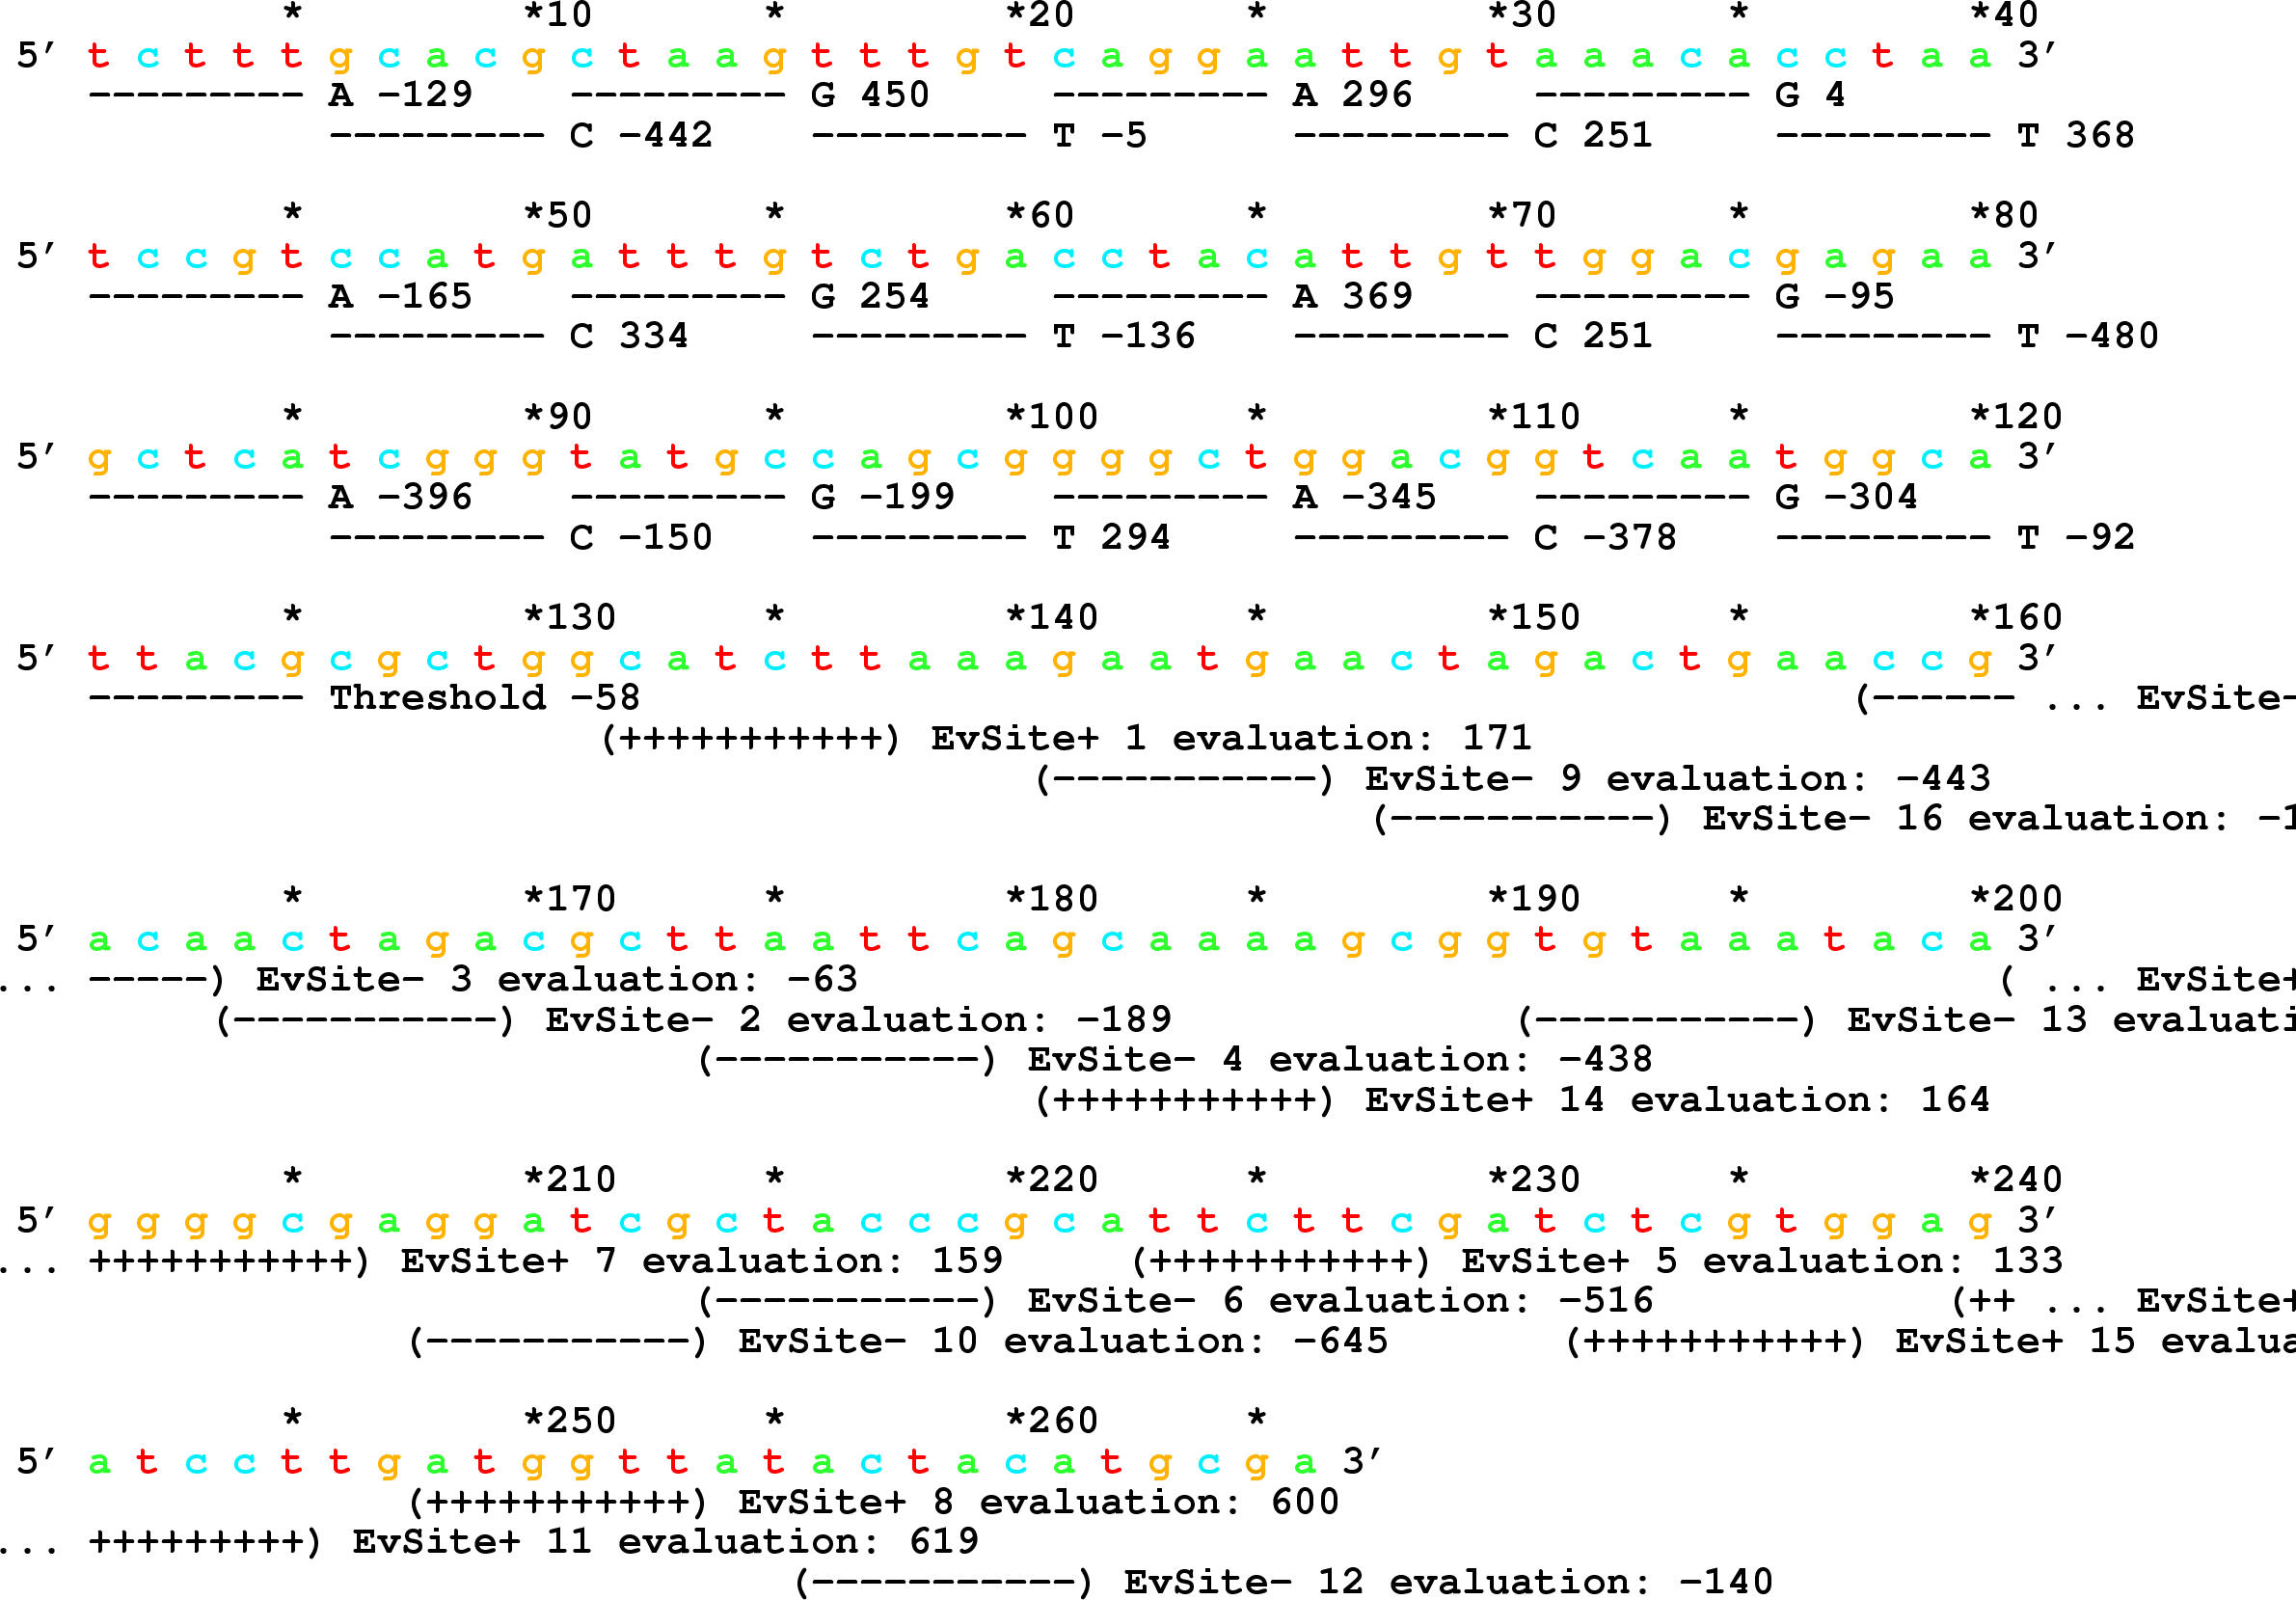
represent the direction of the donor site shown. 14  A sequence from the ev program. A 266 base sequence is
marked every 10 bases.  The first part of the sequence has
a 'gene' with parts marked by underlines.  Each underline
has a letter and a number.  The letters repeat A, C, G, T.
The numbers are computed from the two's complement notation
of the sequence coded as 00, 01, 10 and 11. the remainder
of the genome consists of sites marked with plus (for
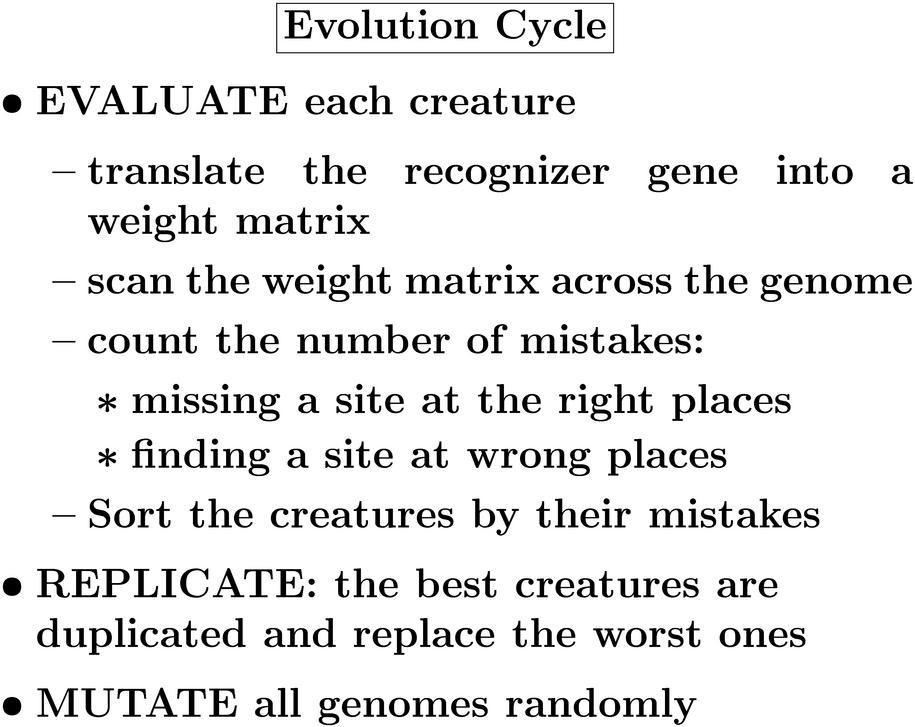
functional) or minus for (non functional). 15  Evolution Cycle * EVALUATE each creature - translate
the recognizer gene into a weight matrix - scan the weight
matrix across the genome - count the number of mistakes: =
missing a site at the right places = finding a site at
wrong places - Sort the creatures by their mistakes *
REPLICATE: the best creatures are duplicated and replace
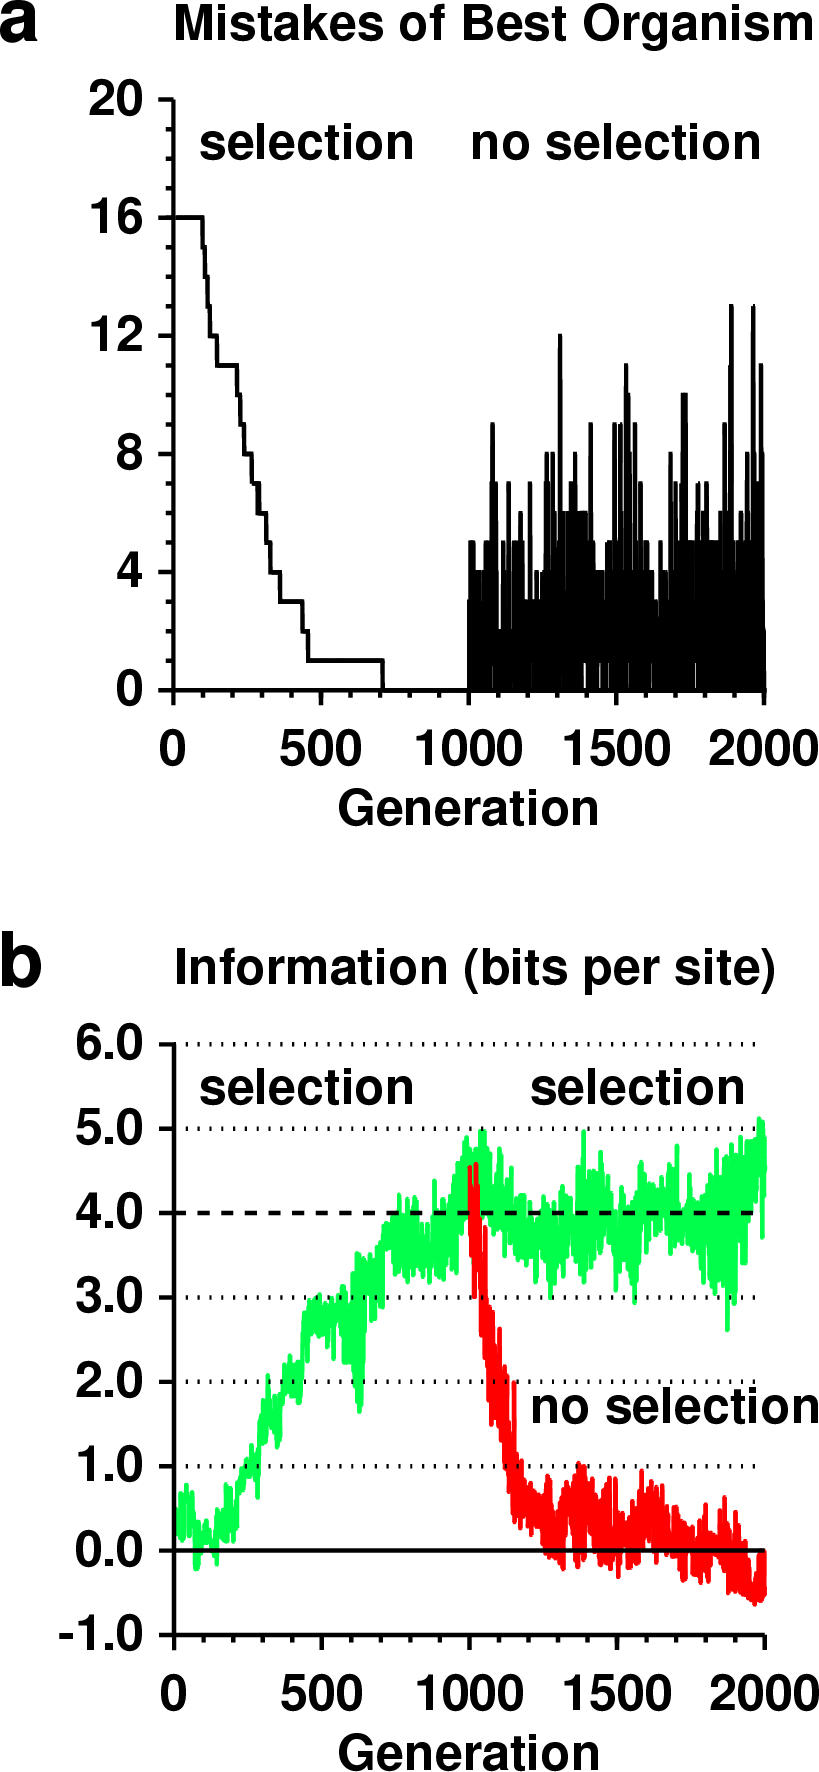
the worst ones * MUTATE all genomes randomly 16  a, Number of mistakes made by the organism with the
fewest mistakes is plotted against the generation number.
b, The information content at binding sites (Rsequence) of
the organism making the fewest mistakes is plotted against
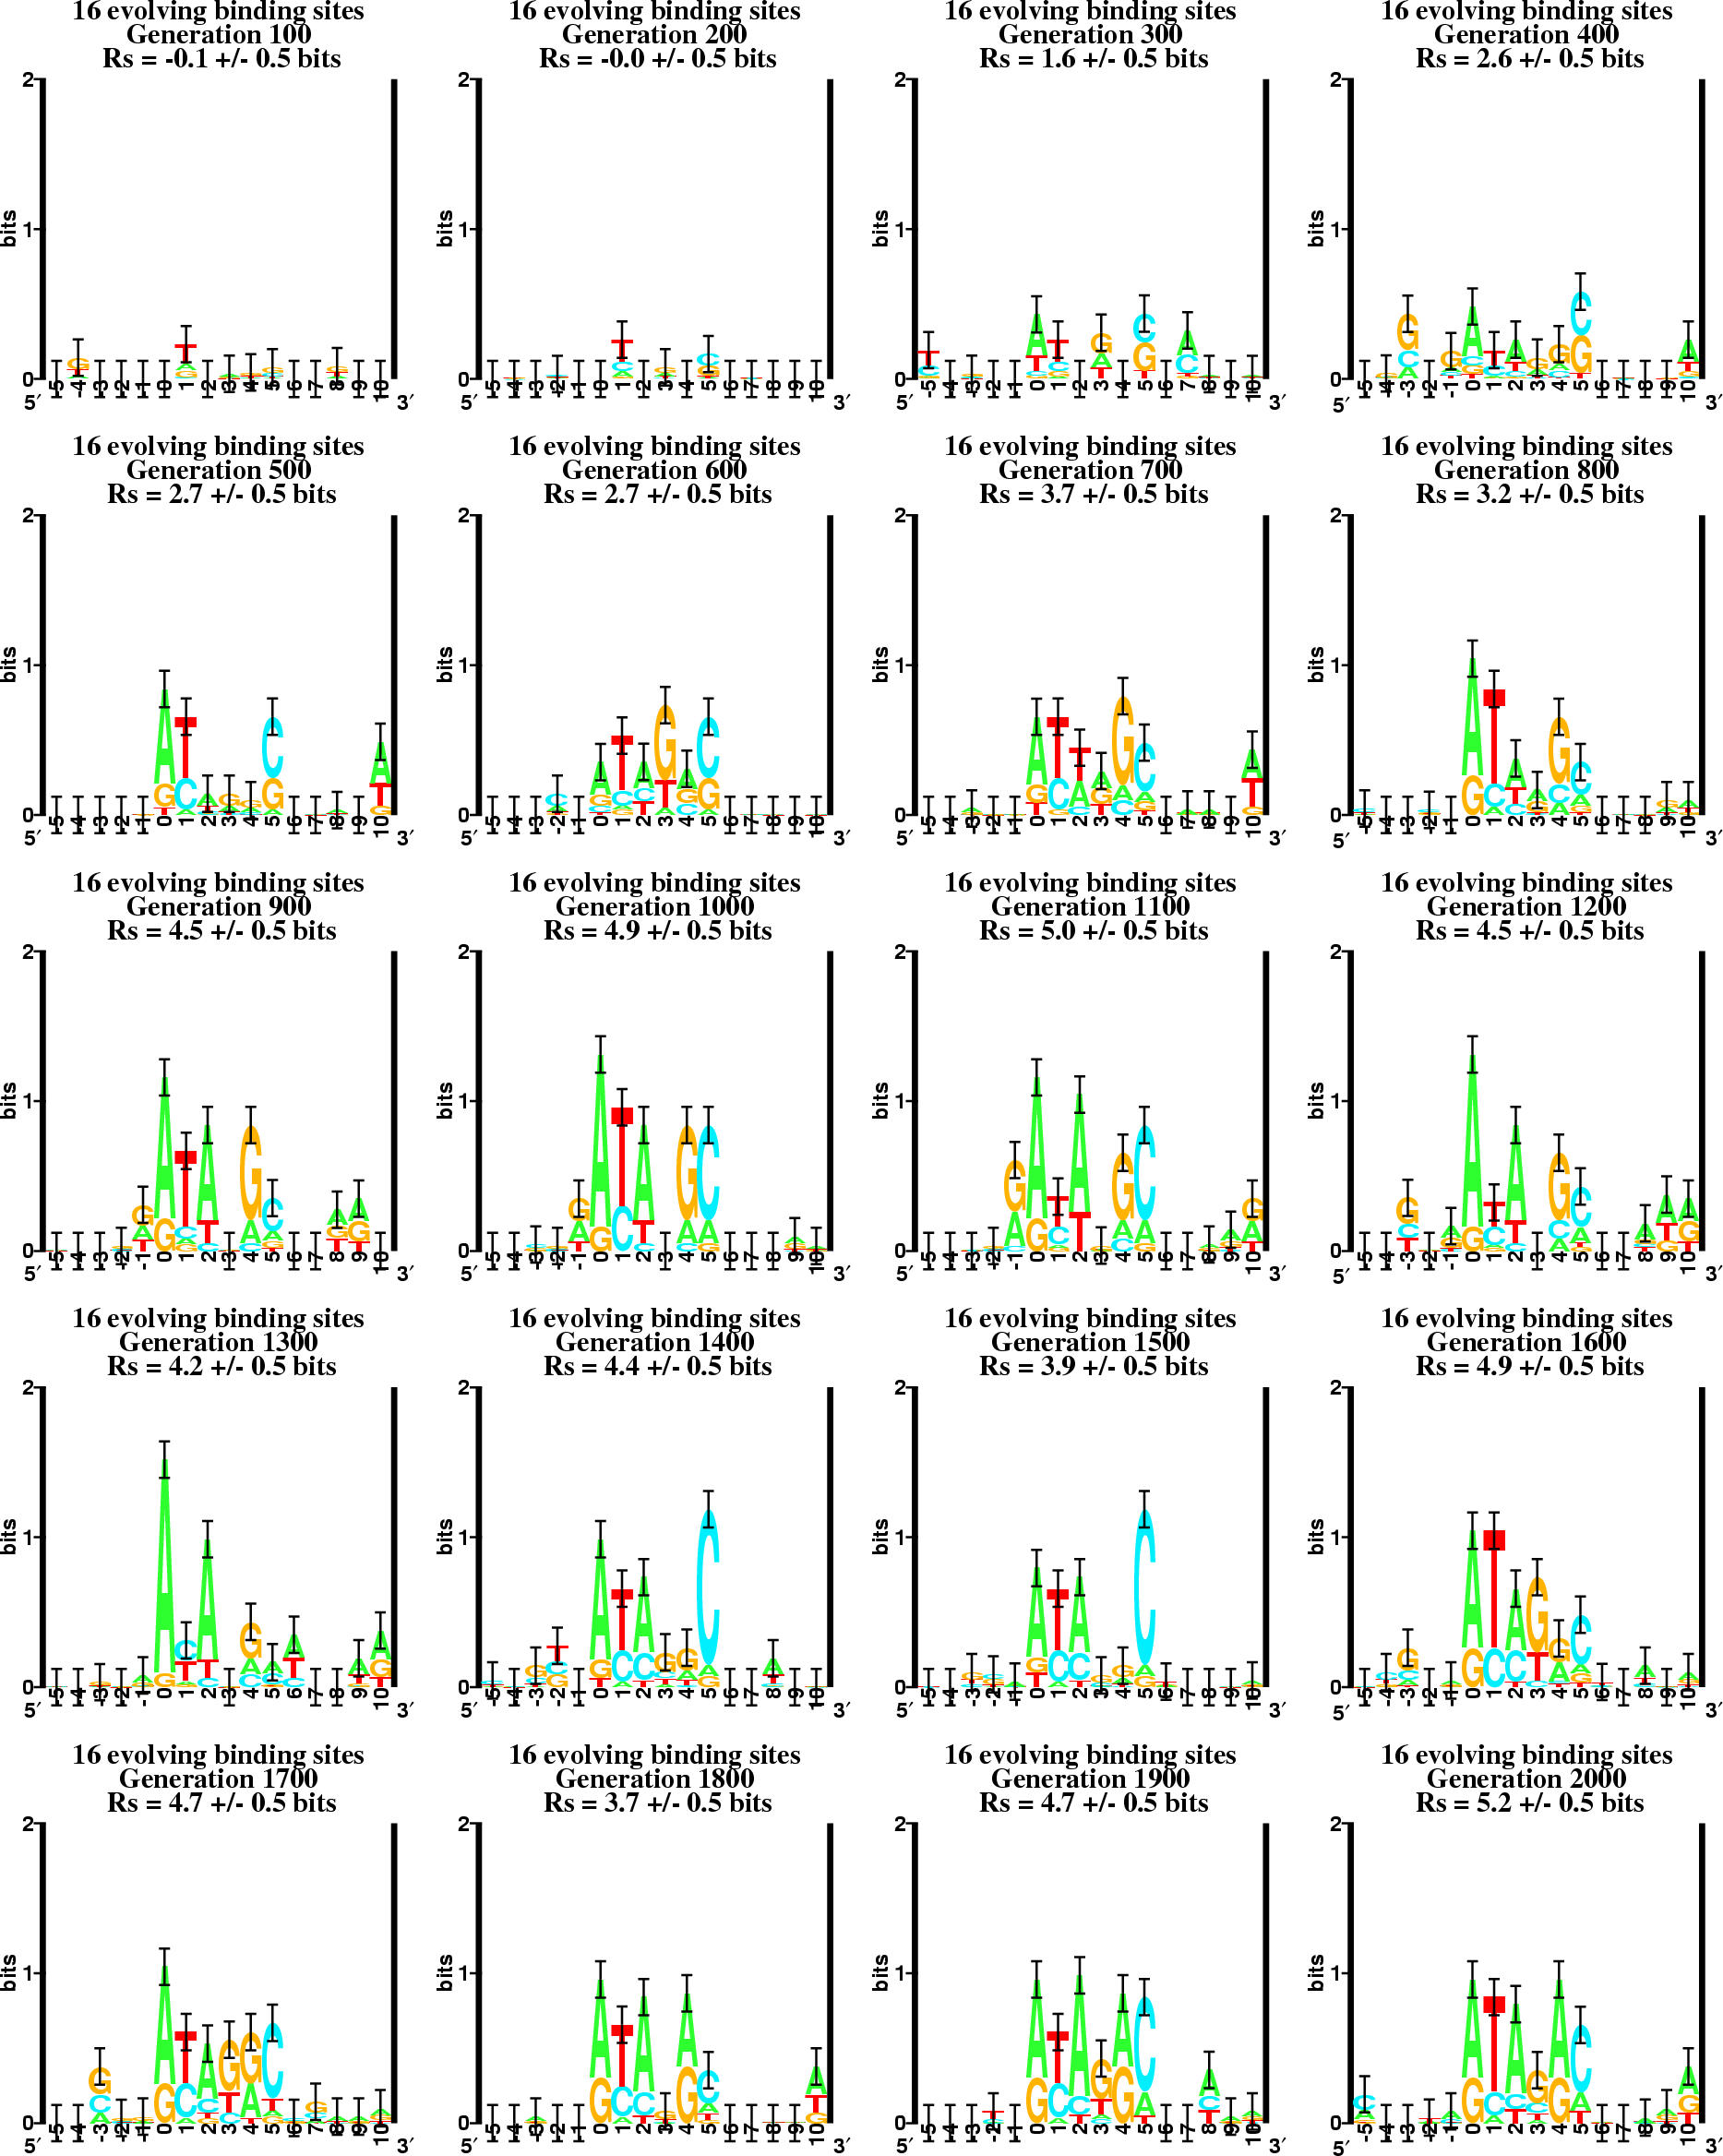
generation number. 17  20 sequence logos of 16 evolving binding sites
generation 100 (-0.1 +/- 0.5 bits) to  generation 2000 (5.2
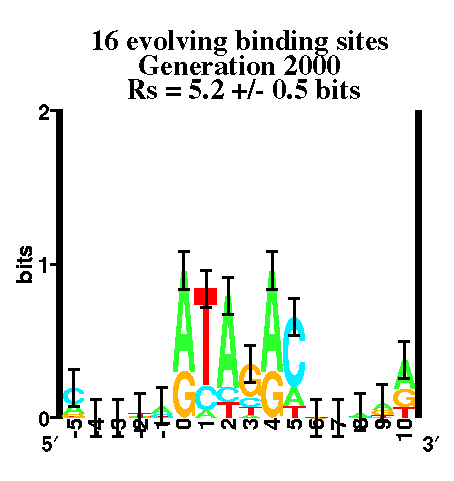
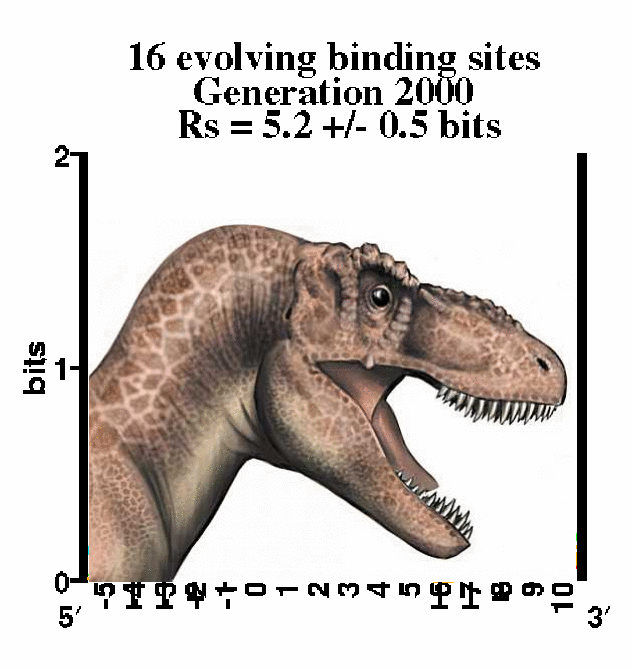
+/- 0.5 bits). 18  16 evolving binding sites generation 2000 Rs = 5.2 +/-
0.5 bits 19  Head of a T. Rex in the place of a sequence logo
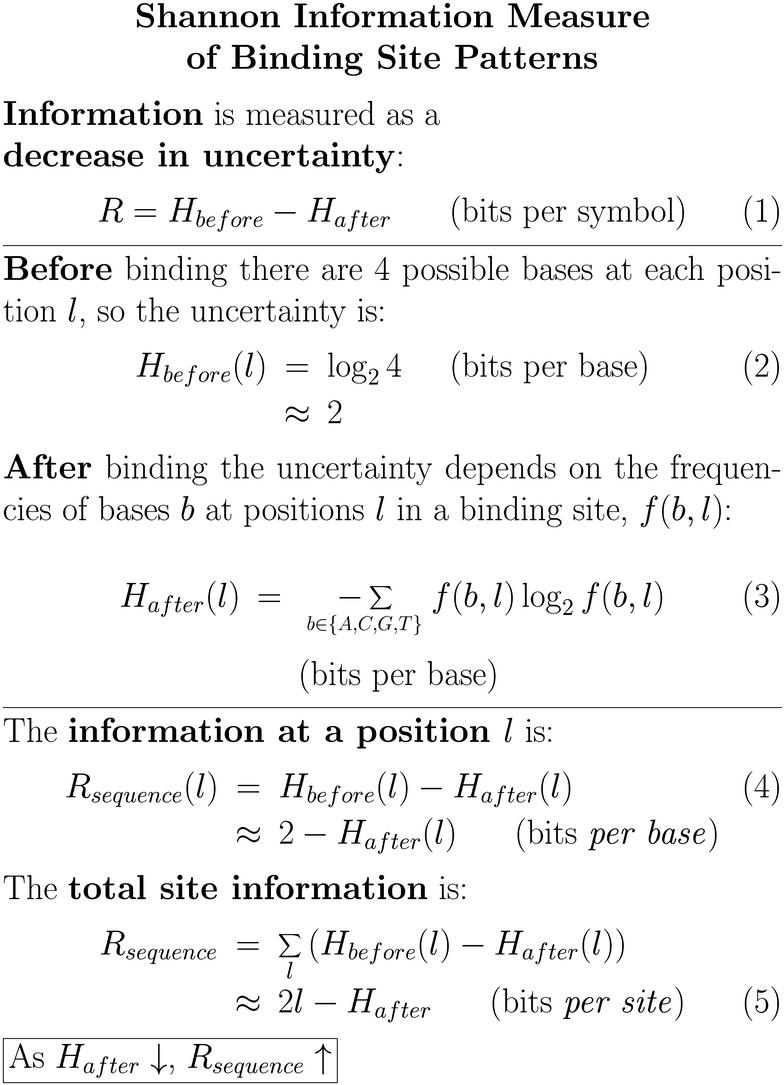
graphic. 20  Shannon Information Measure of Binding Site Patterns
Information is measured as a decrease in uncertainty: $R =
H_{before} - H_{after}$ (bits per symbol).  Before binding
there are 4 possible bases at each position $l$, so the
uncertainty is: $H_{before}(l) = \log_2 4$ (bits per base)
\approx 2 .  After binding the uncertainty depends on the
frequencies of bases $b$ at positions $l$ in a binding
site, $f(b,l)$: $H_{after}(l) = -\sum b \in \{A,C,G,T\}$
$f(b,l) \log_2 f(b,l)$ (bits per base).  The information at
a position $l$} is: $\rsequence(l) & = & H_{before}(l) -
H_{after}(l) & \approx & 2 - H_{after}(l)$ (bits \emph{per
base}).  The total site information is: $\rsequence & = &
\sum_l \left( H_{before}(l) - H_{after}(l)\right) & \approx
& 2l - H_{after}$ (bits \emph{per site}).  As $H_{after}
\downarrow$, $\rsequence \uparrow$ 21  In the evening a Baryonx dinosaur standing in the pond
has just noticed you.

Printing options:

Tips:

This slide show was created on 2011Aug17.20:35:55 by the slideshow script:
version = 2.22 of slideshow 2011 Aug 17: make a slide show
https://alum.mit.edu/www/toms/ftp/slides
https://alum.mit.edu/www/toms/slideshow
author: Tom Schneider