

Next: Level 1. Machine Capacity:
Up: New Approaches in Mathematical
Previous: New Approaches in Mathematical
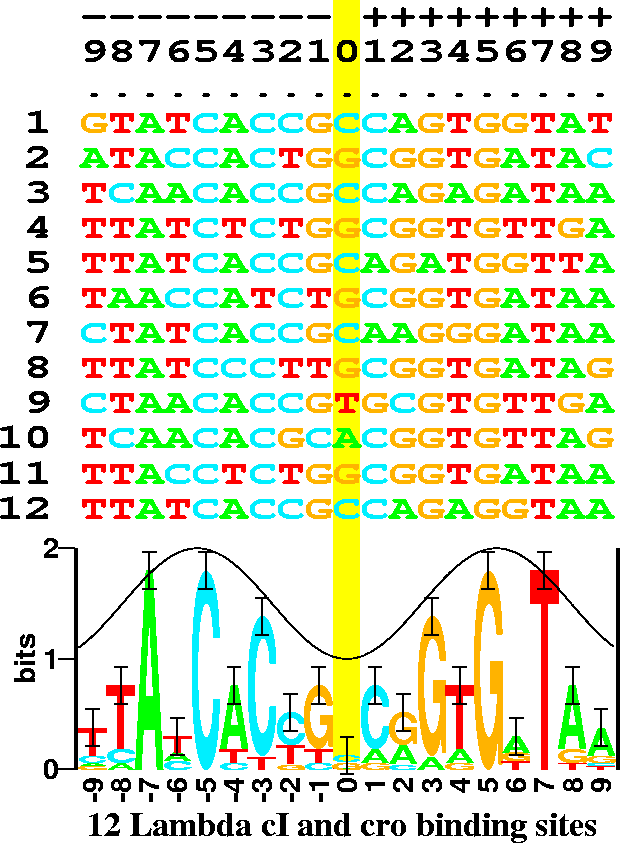
Figure 1:
Example of 12 DNA sequences and their corresponding sequence logo.

There are 6 binding sites, and both proteins are dimers so both the
sequence (odd rows) and its complementary sequence (even rows)
were used for the analysis. This makes the resulting logo have more
data at each position and it also makes the logo symmetrical.
Error bars show the expected variation of the stack heights.
The cosine wave represents the major (crest) and minor (trough) grooves
of DNA facing the protein.
This can be used to predict the face of the DNA bound by the protein
[5]. |
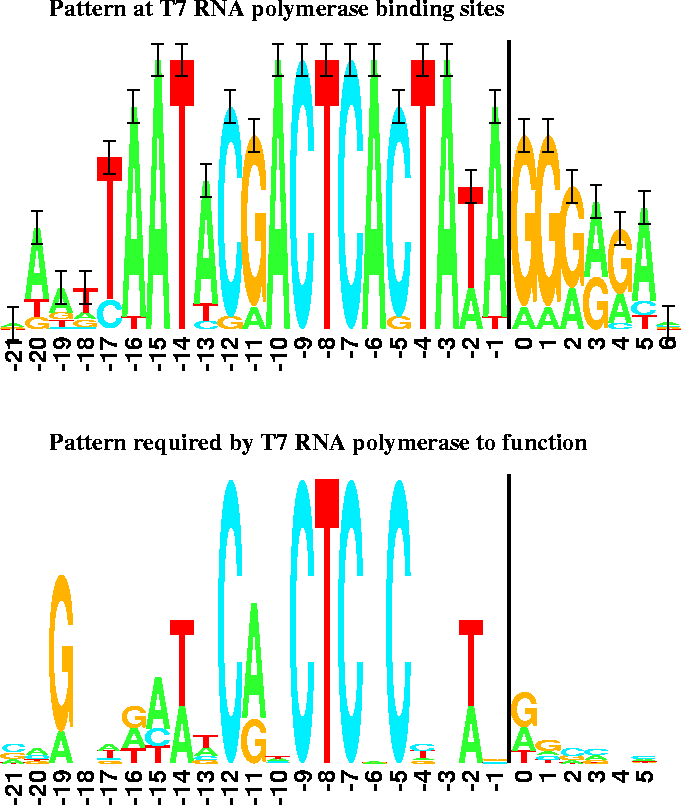
Figure 2:
Sequence logos for T7 promoters.

The vertical bars are 2 bits high.
Transcription starts at base 0 and proceeds to the right. |
Genetic expression is usually controlled by
proteins and other macromolecules (``recognizers'') that bind to specific
sequences on DNA or RNA.
Molecular biologists often characterize
these sequences by a ``consensus sequence''
in which
the most frequent base is chosen
for every position of the binding site.
Because the frequency information is lost,
this method destroys subtle
patterns in the data.
How can we model binding sites without losing data?
Fig. 1 shows the DNA sequences that the cI and cro proteins
from bacteriophage  bind to. Below these is shown a
``sequence logo'' [6].
Consider position -7 in the sequences.
This is always an A
in each of the 12 binding sites, so it is represented as a tall A in the
logo. Position -8 has mostly T's, 2 C's and an A; this is
represented in the logo as a stack of letters. The height of each
letter is drawn proportional to its frequency and the letters
are sorted so that the most frequent one is on top.
The entire height of the stack is the sequence conservation
at that position, measured in bits of information.
A ``bit'' is the choice between two equally likely possibilities.
There are 4 bases in DNA, and these can be arranged in a square:
                           A   C

                           G   T
To pick one of the 4 it suffices to answer only two yes-no
questions: ``is it on top?'' and ``is it on the left?''.
Thus the scale for the sequence logo runs from 0 to 2 bits.
When the frequencies of the bases are not exactly 0, 50 or
100 percent, a more sophisticated calculation must be made.
The uncertainty is a function of the frequency f(b,l) of each base bat position l:
 |
(1) |
where e(n(l)) is a correction for the small sample size n at position l.
The information content (or sequence conservation) is then:
|
Rsequence(L) = 2 - H(L).
|
(2) |
The reasoning behind this formula is described in a
primer on information theory that can be obtained from
https://alum.mit.edu/www/toms/ftp/primer.ps.
The sequence logo shows not only the original frequencies of the bases,
but also shows the conservation at each position in the binding sites.
Because it is a graphic, one can immediately see the pattern
at the binding sites.
In contrast to the sequence logo,
one can be fooled
by the distortions of a consensus sequence in which, for example,
one cannot distinguish 100% A from 75% A.
An important reason that we measure the sequence conservation using
bits of information is that bits are
additive. One can get the total sequence conservation in the binding
site simply by adding together the heights of the sequence logo stacks:
 |
(3) |
This single number alone does not teach us anything, so
we use an entirely different perspective
to approach
the problem of how a recognizer finds its binding sites.
The recognizer
must select the binding sites from all possible sequences
in the genetic material, so we can
calculate how many bits of choices it makes
by determining the size
of the genetic material G and the number of binding sites  .
Before the sites have been located,
the initial number of bits of choice is
 ,
while
after the set of sites have been found
there remain
 choices that have not been made.
So the decrease in uncertainty measures the number of choices made:
 |
(4) |
The name
Rfrequency was chosen because
 is the frequency of the sites.
This number is often close to the value of
Rsequence,
which means that the information content in binding site patterns
is just sufficient for the sites to be found in the genome
[7].
Matt Yarus suggested a simple analogy that
makes this clear. If we have a town with 1000 houses,
how many digits must we put on each house to be sure the mail is delivered
correctly?
The answer is 3 digits since the houses can be numbered 000 through 999.
So there is a relationship between the size of the town (size of genetic material
and number of sites) and the digits on the mail box (pattern at the binding
sites).
A surprising exception appears in the case of bacteriophage T7 promoters
(Fig. 2 top),
where
 bits per site
but
Rfrequency= 16.5 bits per site.
There is a
 fold excess of sequence conservation.
Either the theory is wrong or we are learning something new.
In the town analogy, there are 1000 houses, but each house has 6 digits on it.
One explanation is that there are two independent mail delivery systems
that could not agree on a common address system.
The biological explanation is that there are two proteins binding at these
patterns.2
We already know about one of them, it is the T7 RNA polymerase.
To test this idea, a large number of random DNA sequences were constructed
and then ones which still functioned as T7 promoters were selected
[8].
If there is another protein, then it would not be binding in this test
and so the excess information would disappear.
This is indeed what happened (Fig. 2 bottom):
the binding sites for T7 promoters alone only have
  bits of
information, close to the predicted value of
Rfrequency= 16.5 bits per site.
The hypothesis that there is a second protein was upheld,
but to date we have not identified it experimentally.
Later on we discovered another case in the F plasmid incD region
where
 bits per site
and
Rfrequency= 19.6 bits per site
so that there is a
 fold excess of sequence conservation.
Three proteins have been seen to bind to this DNA,
and we were able to tentatively identify them [9].


Next: Level 1. Machine Capacity:
Up: New Approaches in Mathematical
Previous: New Approaches in Mathematical
Tom Schneider
2000-10-13


